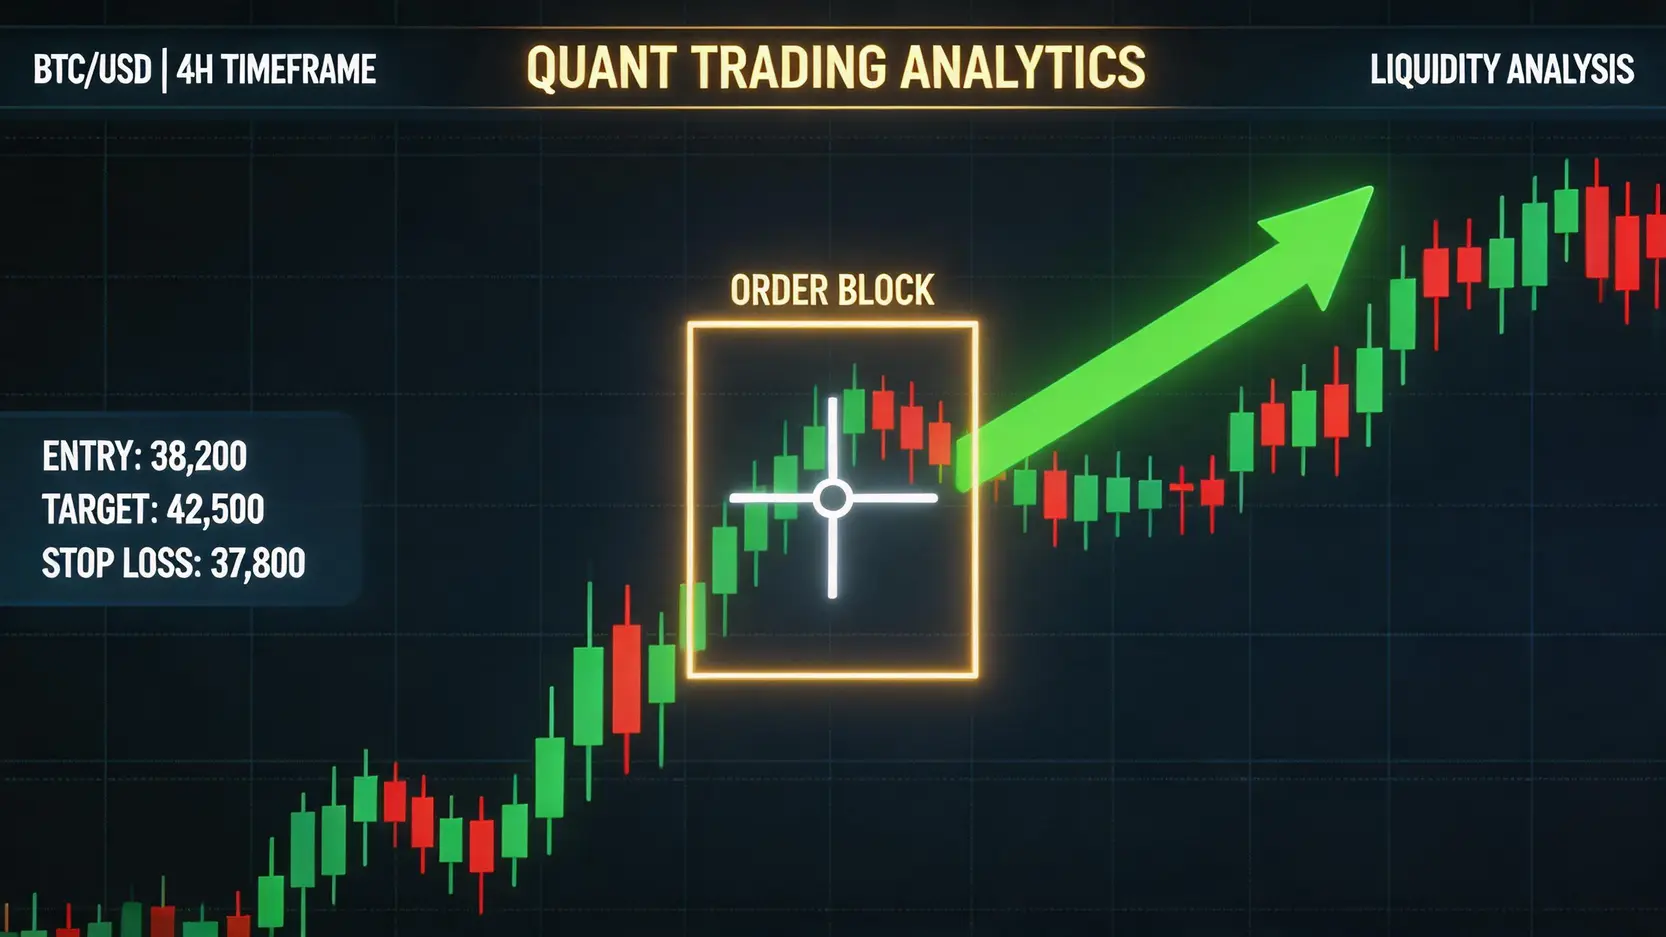
Order Block Strategy: 3-Step SMC Zone Guide

Order Block Trading Strategy: 3 Steps to Identify High-Probability SMC Key Zones
Do you often miss the best entry points in trading, or get misled by false breakouts? Mastering the “Order Block” concept within Smart Money Concepts (SMC) is key to identifying institutional money flow and improving trading win rates. This detailed Order Block identification guide will take you deep into how to find Order Blocks and break down practical Order Block trading strategies, helping you follow “smart money” more precisely, capture market opportunities, and avoid becoming “liquidity” for the market.
Core Guide to Order Blocks: From Definition to Identification
To integrate Order Blocks into your trading system, you must first fully understand their logic and identification process. It is not just about finding a specific candlestick, but about understanding the market narrative.
What Is an Order Block? The Core Concept of SMC Trading
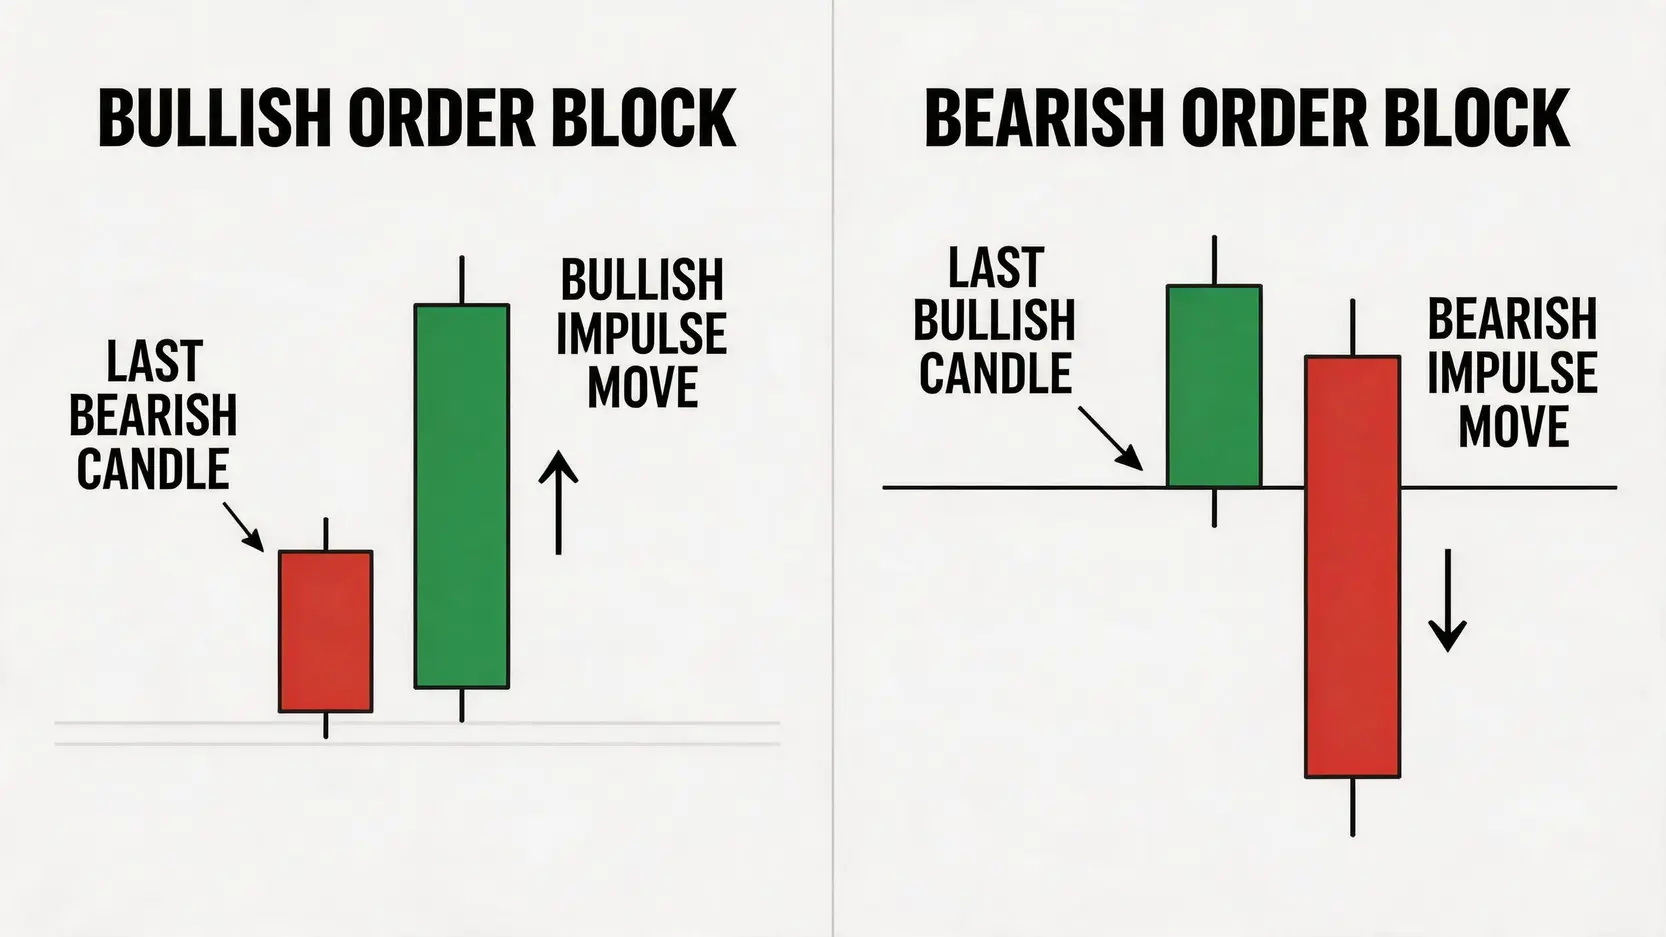
Within the framework of “Smart Money Concepts” (SMC), an Order Block refers to the last opposite-direction candlestick before a strong, one-sided “inefficiency” move. Simply put:
- Before a strong upward move, the last bearish candlestick is the “Bullish Order Block”.
- Before a strong downward move, the last bullish candlestick is the “Bearish Order Block”.

Bullish Order Blocks (left) and Bearish Order Blocks (right) core structure illustration.
These zones are important because they represent areas where large financial institutions (i.e., “smart money”) place significant orders and accumulate positions. When price later returns to these zones, institutions may defend or add to their positions, thereby pushing price again and creating high-probability trading opportunities for us. Understanding the formation mechanism of Order Blocks is the foundation of SMC trading strategies.
3 Steps to Identify High-Probability Order Blocks: Market Structure, Key Candles, and Price Imbalance
A valid Order Block is not found everywhere. By following these three steps, you can filter out the key zones that truly matter from the chart:
- Step 1: Confirm Market Structure Shift (Break of Structure, BOS)
This is the most important step. A strong Order Block must be associated with a valid Break of Structure, where price breaks the previous market structure high (in an uptrend) or low (in a downtrend). This structural breakout (BOS) confirms that institutional participation is real and strong, rather than random price movement. Without a strong structural break, the reliability of the Order Block is significantly reduced. Understanding market structure is the foundation of all trading strategies. - Step 2: Identify the Key Candle (The Order Block Candle)
After confirming BOS, trace backward to locate the last opposite-direction candlestick that caused the move. For example, in an uptrend where price breaks a previous high (BOS), the last “bearish candlestick” before the rally is the Bullish Order Block. - Step 3: Identify Price Imbalance Zone (Imbalance / FVG)
A high-quality Order Block is usually accompanied by an “Imbalance”, also known as a “Fair Value Gap (FVG)”. This refers to a sequence of strong candles where price moves aggressively with no overlap between wicks. This “gap” reflects extreme imbalance between buying and selling pressure and serves as direct evidence of institutional participation, further confirming the validity of the Order Block.

High-Probability Order Block Identification Sequence: BOS → Key Candle → Imbalance Zone.
Further Reading (Highly Recommended)
Hong Kong 0DTE Options Beginner Guide: 5 SPX Strategies, Trading Platforms, and Full Risk Breakdown
Practical Application: Two Order Block Trading Strategies and Risk Management
After learning “how to identify Order Blocks”, the next step is applying them in real trading. Below are two core Order Block trading strategies from beginner to advanced level.
Beginner Strategy: Order Block Retest Entry and Stop Loss Setup
This is the most classic and beginner-friendly SMC Order Block application strategy. The core idea is to wait for price to retrace into the previously identified Order Block zone before entering a trade.
- Entry: When price retests the upper boundary (Bullish OB) or the lower boundary (Bearish OB), it can be considered an aggressive entry signal. A more conservative approach is to wait for price to reach the 50% level of the Order Block (mean reversion level).
- Stop Loss: Stop loss placement is straightforward. For a Bullish OB, place it below the lowest point of the Order Block. For a Bearish OB, place it above the highest point. Always leave some buffer to avoid stop hunts.
- Take Profit: Targets are usually set at the next liquidity pool, such as previous swing highs or lows. A healthy risk-reward ratio should be at least 1:2 or higher.

Bullish OB Retest Trading Strategy Example
Trading Example (Bullish):
- Price forms a BOS after an upward move, breaking a previous high.
- Identify the last bearish candlestick before BOS and mark it as a Bullish Order Block.
- Wait patiently for price to retrace into the Order Block zone.
- Place a buy limit order when price touches the upper boundary of the OB or the 50% level.
- Set stop loss below the lowest point of the OB.
- Target the next untested high as take profit.
Advanced Application: How to Distinguish Strong vs Weak Order Blocks and Avoid Common Traps
As experience builds, you will realize that not all Order Blocks are worth trading. Learning to distinguish between strong and weak Order Blocks is key to improving win rate in Order Block trading strategies. Below are key evaluation criteria:
- Strong Order Block Characteristics:
- Strong Break of Structure (BOS): The stronger the momentum, the more reliable the OB.
- Clear Price Imbalance (FVG): Larger gaps indicate stronger institutional involvement.
- Liquidity Grab before breakout: If price first breaks a short-term low (or high) before the move, this “liquidity sweep” is a typical institutional stop hunt, and the resulting OB is often highly effective.
- Unmitigated: A fresh Order Block that has never been retested has the strongest validity.
- Weak Order Block Characteristics (Traps to Avoid):
- No structural break: A simple rebound without breaking key structure is often unreliable and may become a target for price.
- Mitigated multiple times: Each retest reduces the internal order flow within the OB, weakening its effectiveness and increasing failure probability.
- Located in the middle of a trading range: OBs in the middle of consolidation zones often lack directional clarity and are easily swept back and forth, so priority should be given to OBs at range extremes.
FAQ: Common Questions About Order Blocks
Are Order Blocks applicable to all timeframes?
Yes, the concept of Order Blocks is universally applicable across all timeframes, from 1-minute and 15-minute intraday trading to 4-hour and daily swing trading. The key is maintaining consistency in analysis and execution. For example, if you identify an Order Block on the 4-hour chart, your entry and exit decisions should also be based on the market structure of that timeframe, avoiding confusion caused by lower-timeframe noise.
What is the difference between Order Blocks and traditional support and resistance?
Traditional support and resistance zones are typically drawn based on historical price reversal points and mainly describe “where price has reacted before”. In contrast, Order Blocks go one step further by explaining “why price reacts at that level” which is driven by institutional order flow logic. Order Blocks are usually more precise and narrower price zones, and they require confirmation through Break of Structure (BOS) and Price Imbalance (FVG), which is the key difference from traditional support and resistance.
What should you do if price directly breaks through an Order Block?
This is a critical risk management issue. If price directly breaks through your identified Order Block without any reversal reaction, it means the Order Block has failed. In this case, the correct action is to accept the loss and reassess the market structure. A broken Bullish Order Block may indicate that the broader downtrend is still intact, and the zone may turn into a “Breaker Block”, potentially acting as future resistance. Never add to losing positions after an Order Block is invalidated.
How to distinguish Bullish and Bearish Order Blocks?
The distinction is straightforward and mainly based on their position within market structure and subsequent price behavior:
Bullish Order Block (Bullish OB): Refers to the “last bearish candle” before price makes a strong upward move and breaks a previous high (BOS). It represents a potential zone of buying interest.
Bearish Order Block (Bearish OB): Refers to the “last bullish candle” before price makes a strong downward move and breaks a previous low (BOS). It represents a potential zone of selling interest.
Conclusion
In summary, mastering Order Block identification is a foundational skill for SMC trading strategies. Through the three key steps (confirm BOS, identify key candle, locate imbalance zones) and practical application models in this guide, you should now have a clearer understanding of “how to find Order Blocks”. A high-quality Order Block represents a clear footprint left by institutional money. Remember, the essence of trading is quality over quantity. Instead of chasing every perceived opportunity, focus on identifying and patiently waiting for Order Blocks that meet all strong criteria. Consistent practice and review are the only ways to fully master Order Block trading strategies. Open your chart and start practicing today to elevate your trading performance!
Related Articles
-
How to Get Started with Bitcoin? The Complete 2026 Bitcoin Buying Guide for Beginners After watching Bitcoin repeatedly reach new highs in recent years and successfully pass spot ETF reviews in the US and Hong Kong in 2024, officially entering mainstream financial markets, many investors have turned their attention to...2026 年 7 月 20 日
-
Is Gold’s V-Shaped Rebound a Bottom-Fishing Signal? A Complete Guide to Trading Strategies Amid “$100 Price Swings” What Is a Gold V-Shaped Rebound? More Than Just a Technical Pattern The gold market has recently experienced sharp rises and falls, with prices frequently displaying dramatic “gold V-shaped rebounds”. Single-day “$100 price...2026 年 7 月 20 日
-
What Is PPI Data? 2026 Latest Analysis: Understand the Differences from CPI and How It Affects Stock Market Trends With market information constantly changing, do you always hold your breath while waiting for CPI data to be released? But did you know that a more forward-looking inflation indicator, PPI data...2026 年 7 月 20 日