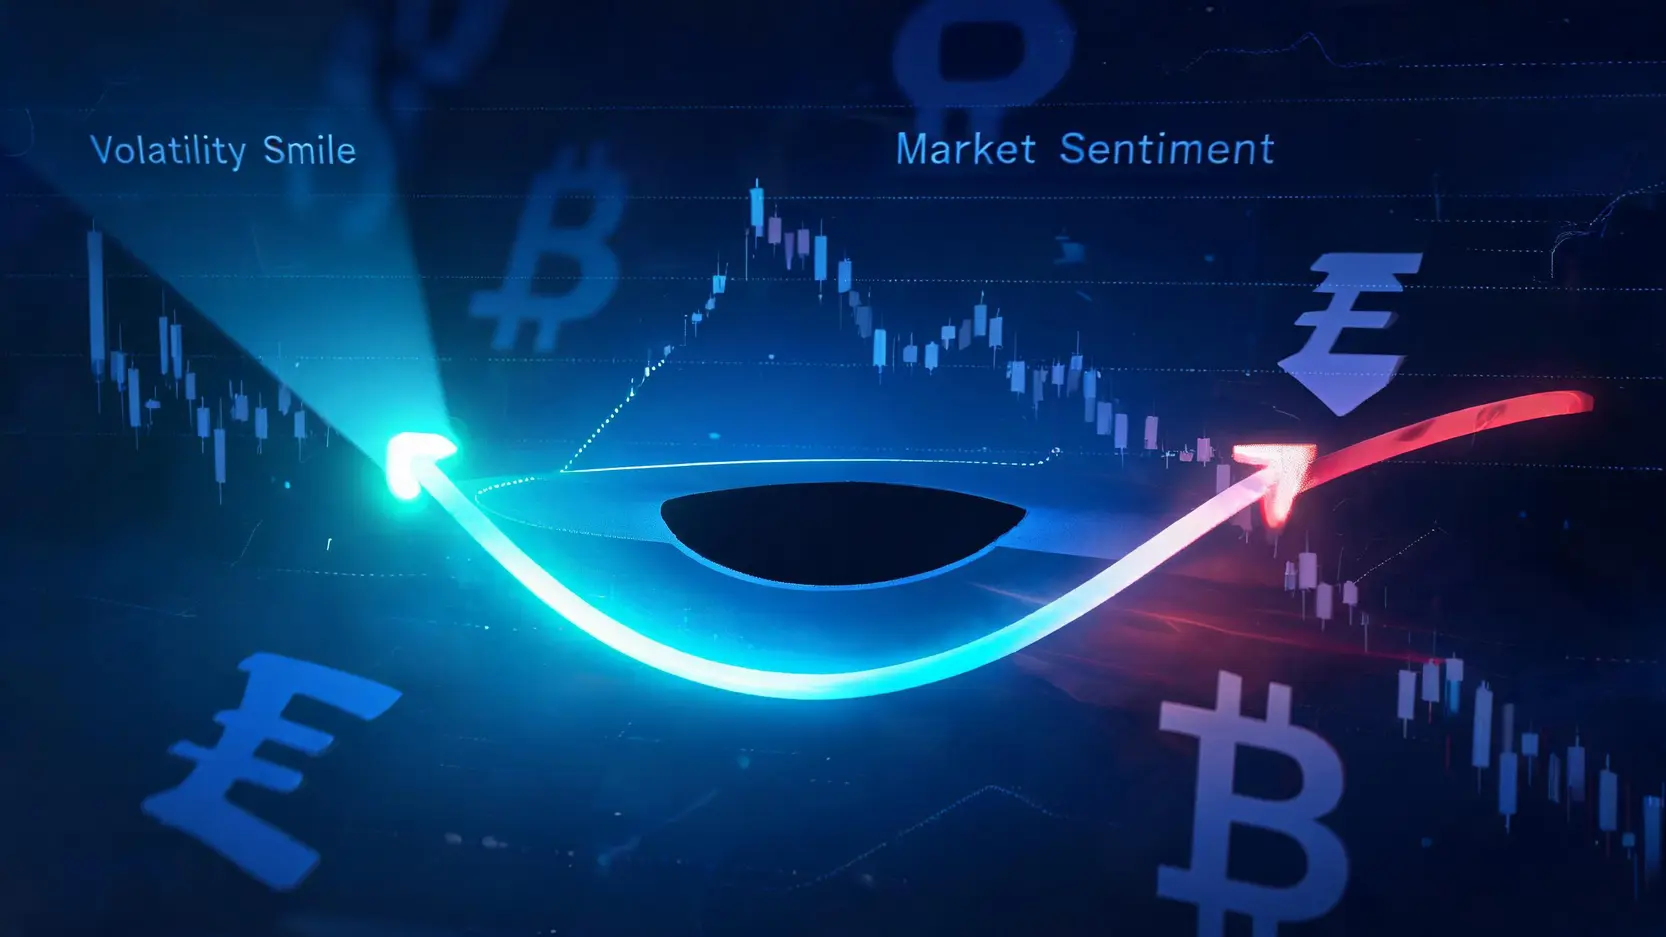
Options Skew Guide: Volatility Smile & Sentiment

Updated: 2026/05/08  |  CashbackIsland

option-skew-volatility-smile-guide

Mastering Option Skew Analysis: Using the “Volatility Smile” to Predict Market Sentiment and Avoid Investment Traps

In the ever-changing financial markets, the ability to anticipate trends and interpret market direction is a core skill for every investor. When overall market data appears chaotic, options market data often provides more forward-looking signals. Have you heard of “option skew analysis” or “Option Skew” but not known where to start? In fact, learning how to interpret market conditions using the volatility smile is a key step from beginner to professional trader. This article breaks down the core concepts of Option Skew and the volatility smile in a clear and practical way, and provides a complete 5-step guide to help you accurately assess market sentiment and improve your trading decisions. 


What Is Option Skew? The First Step to Reading Market Sentiment

To understand option skew analysis, you must first grasp two key concepts: implied volatility (IV) and skew. Together, they form a powerful tool for measuring market sentiment.


Starting from the Basics: The Relationship Between “Skew” and “Implied Volatility”

“Implied volatility” can be understood as the market’s “expectation” of future price fluctuations. The higher the IV, the greater the expected volatility of the asset price; the lower the IV, the more stable the market is expected to be. In theory, for the same asset and expiration date, IV should be identical across all strike prices. However, in reality, this is not the case.

“Skew” describes this “inconsistency”. It refers to the asymmetric or tilted pattern of implied volatility across different strike prices. This tilt is not random; it directly reflects how market participants price the risk of upward or downward movement. In simple terms, how to read Option Skew is essentially understanding which direction the market fears more. 


Positive Skew vs Negative Skew: A Market Sentiment Indicator

Option skew can be divided into two types, acting like a “barometer” of market sentiment, showing whether optimism or fear dominates:

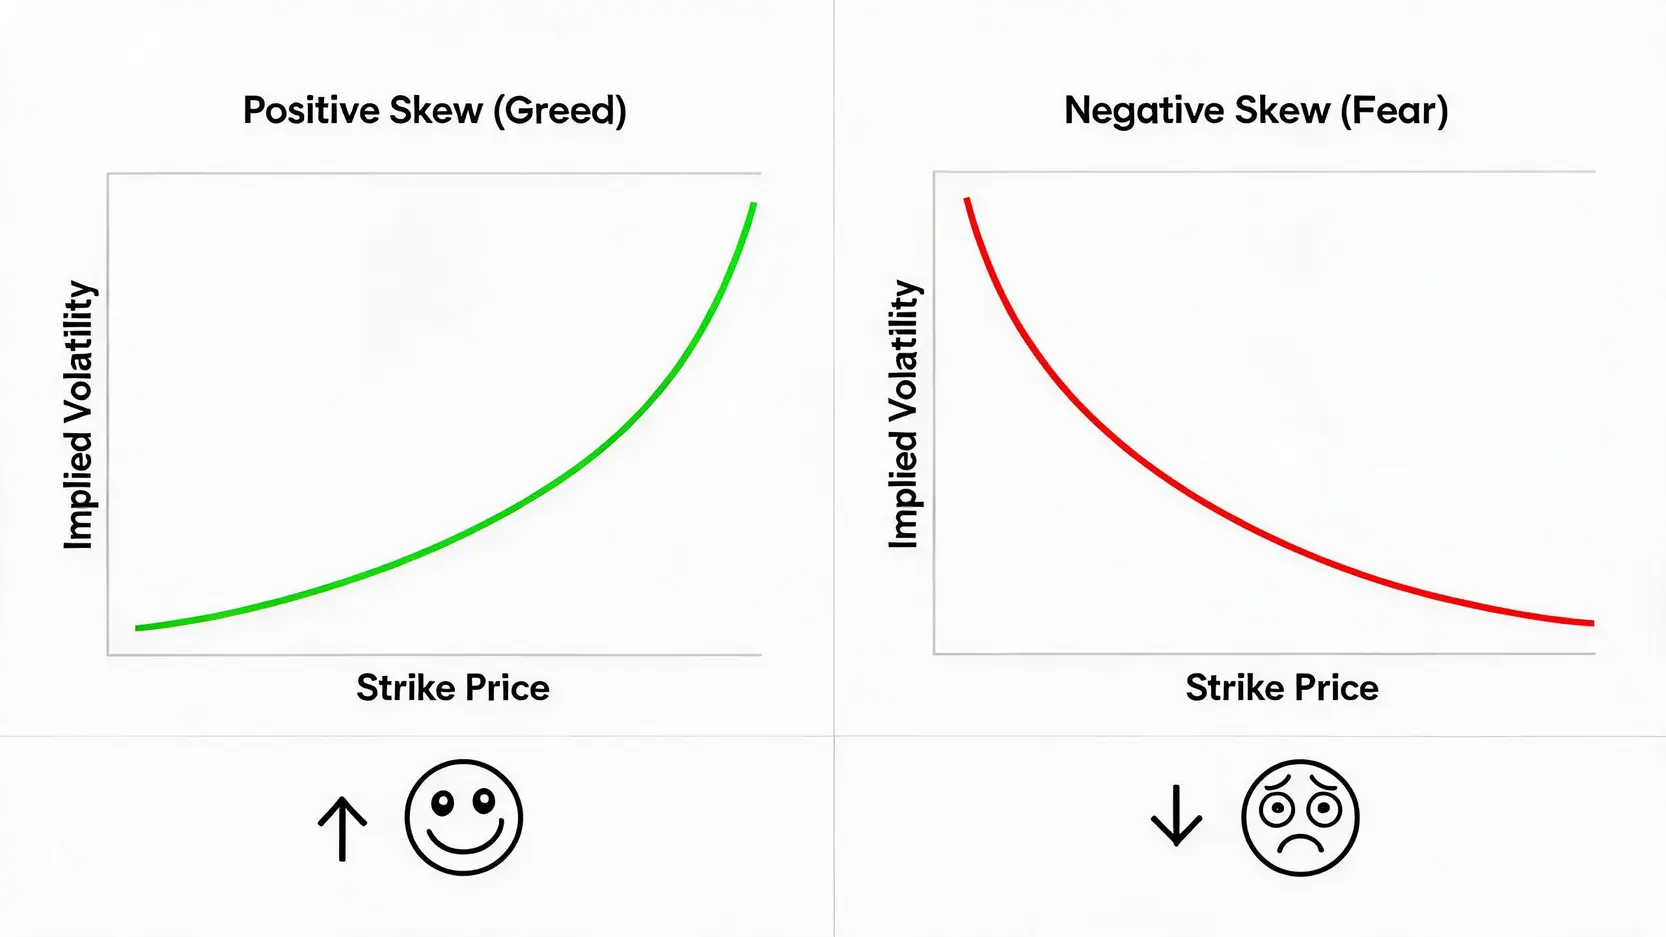
  • Positive Skew: Occurs when out-of-the-money call options have higher implied volatility than out-of-the-money put options. This indicates stronger demand for upside exposure, reflecting bullish or “greedy” sentiment. It is often seen in commodity markets or during bullish news-driven rallies.
  • Negative Skew: Also known as “fear skew”, this is the most common form. It occurs when out-of-the-money put options have significantly higher implied volatility than calls. This indicates that market participants are more concerned about the risk of a sudden sharp decline in asset prices, and are therefore willing to pay higher prices for bearish protection (Put Options).It directly represents “fear” and risk aversion in the market.

正偏度與負偏度的對比圖,展示了兩種市場情緒下的波動率曲線形態。

Positive Skew (Greed) vs Negative Skew (Fear): Market Sentiment at a Glance


Why Do Index Options Usually Show Negative Skew (Fear Skew)? 

In equity index markets (such as the S&P 500 or Hang Seng Index), negative skew is the norm. The reason is simple: market structure is inherently more fearful of downside risk. Investors are far more concerned about sudden crashes (black swan events), which tend to be fast and severe. In contrast, upward moves are usually gradual. As a result, institutional investors continuously buy out-of-the-money puts as portfolio insurance. This steady demand drives up the implied volatility (IV) of out-of-the-money puts, thereby creating a deeply entrenched negative skew. When negative skew expands sharply, it often signals rising market fear.


Understanding the Volatility Smile: The Hidden Truth Across Strike Prices

If we plot implied volatility across all strike prices for the same expiration, we typically get a curve known as the “volatility surface”. One of the most classic patterns is the “volatility smile” which reveals how different strikes are priced.


Volatility Smile Explained: Why OTM Options Often Have Higher IV?

A standard “volatility smile” pattern occurs when implied volatility at both ends of the curve (deep in-the-money and deep out-of-the-money options) rises and is higher than that of at-the-money (ATM) options in the middle, forming a shape that resembles a smiling mouth. The underlying logic is as follows:

The market believes that extreme events (whether sharp rallies or crashes), although low in probability, can have a massive impact once they occur. As a result, traders are willing to pay higher premiums for these “black swan” risks. This drives up the implied volatility of deep out-of-the-money (Deep OTM) call and put options, even though their intrinsic value is zero in nominal terms, reflecting the market’s preventive pricing of extreme volatility.


“Smile” vs “Smirk”: Typical Market Structures Explained

The volatility curve does not always form a perfectly symmetrical smile. Instead, it evolves into different shapes depending on the characteristics of the underlying asset:

  • Volatility Smile: A relatively symmetrical shape where both sides rise and the middle is lower. It is commonly seen in the foreign exchange market. This is because a currency can appreciate sharply due to positive policy developments or depreciate sharply due to crises, resulting in more balanced two-way risk.
  • Volatility Smirk (Skew): An asymmetric curve where one side is higher than the other. This is what we previously referred to as “skew”. In stock and index markets, this is most commonly observed, where the put side (left side) is usually higher, forming a “smirk” that slopes upward to the left. This is a typical example of negative skew or the fear skew. This represents a classic negative skew or fear skew.

波動率微笑與波動率假笑的形態對比圖。

“Smile” vs “Smirk”: Volatility Curve Characteristics Across Markets

By observing the shape and tilt of this “smile”, investors can visually interpret volatility smile structures to understand current market preferences and fear levels. 

Further Reading (Highly Recommended)

A Must-Read on Yen Appreciation: How to Identify “False Breakouts” Using Technical Analysis


【Practical Guide】5 Steps to Use Option Skew and the Volatility Smile to Assess Market Conditions

Theory is done. Now let’s move into real-world application. By following these five steps, you can integrate option skew analysis into your daily trading decisions.

期權偏度分析的五個步驟流程圖,從選擇資產到制定策略。

The 5-Step Option Skew Framework: A Complete Path From Data to Decision


Step 1: Select Your Target Asset (e.g., Hang Seng Index, S&P 500, BTC)

First, define the market you want to analyze. Different asset classes exhibit different skew characteristics. For example, equity indices (such as the Hang Seng Index or S&P 500) typically show a stable negative skew, while cryptocurrencies (such as Bitcoin (BTC)) may swing between positive and negative skew, reflecting their high volatility and sentiment-driven nature.


Step 2: Obtain Option Chain Data and Focus on Implied Volatility (IV)

You need access to the option chain of your target asset. Many financial platforms (such as Yahoo Finance) or brokerage systems provide this data. Within the option chain, focus on implied volatility (IV) across different strike prices for the same expiration date, including both call and put options.


Step 3: Observe the Volatility Curve Shape (Smile or Skew?)

Plot the IV data into a chart, with strike price on the horizontal axis and implied volatility on the vertical axis. Then observe the overall shape:

  • Is it a symmetrical “smile” (balanced perception of upside and downside risk)?
  • Or is it clearly tilted into a “smirk” (market pricing one direction more heavily)?


Step 4: Analyze Skew Direction (Put-Skewed or Call-Skewed? Fear or Greed)

If the curve is tilted, determine its direction:

  • Put-skewed (left higher, right lower): OTM puts have higher IV, indicating fear of downside risk and bearish sentiment. This is a negative skew.
  • Call-skewed (right higher, left lower): OTM calls have higher IV, indicating bullish sentiment and risk-seeking behavior. This is a positive skew.

The “steepness” of the skew is also important. An extremely steep negative skew may signal extreme fear and potential heavy selling pressure.


Step 5: Combine Market Context and Build Trading Decisions

The final and most critical step is to combine your skew observation with macroeconomic conditions, news events, and technical indicators. For example:

  • At market highs with rapidly increasing negative skew: This is a warning sign. Even if prices are still rising, smart money may already be buying downside protection. You may consider reducing exposure or hedging.
  • During prolonged consolidation with low skew levels: This may indicate stable sentiment and lower probability of sharp moves in the short term.
  • Extreme positive skew in crypto markets: This may indicate a FOMO-driven phase with strong upward momentum, but also elevated bubble risk.


Real Case Studies: Applying Option Skew From Crypto to Indices

Let’s look at two real-world cases to understand how to interpret Option Skew and how to apply it in practice.


Case 1: Using BTC Option Skew to Detect Extreme Market Sentiment

The cryptocurrency market is known for its extreme sentiment-driven volatility. At the peak of the 2021 bull market, the BTC options market showed a clear positive skew, with traders aggressively buying out-of-the-money calls, betting that prices would continue to rise indefinitely. However, when the market reversed and entered a bear phase, skew quickly shifted to negative. During events such as the collapse of platforms like FTX, negative skew reached extreme levels, reflecting intense market panic and strong expectations of further downside. Monitoring shifts in BTC skew can help traders identify key turning points in market sentiment.


Case 2: How Hang Seng Index Option Skew Signals Potential Downside Risk?

The Hong Kong Hang Seng Index is a classic example. Due to its market structure and investor behavior, Hang Seng Index options tend to maintain a persistent negative skew. However, what traders should focus on is the “rate of change” in skew. For example, ahead of earnings seasons or major policy announcements, if a sharp increase in negative skew is observed within a short period (with out-of-the-money put IV rising disproportionately), it often signals heightened sensitivity to potential negative news. Even if the index has not yet declined, this should be treated as an important early risk warning signal.


Frequently Asked Questions (FAQ) on Option Skew Analysis

Q: Is option skew analysis applicable to all markets?

A: Yes, the concept of option skew analysis applies to any asset with an active options market, including stocks, indices, foreign exchange, commodities, and cryptocurrencies. However, the “normal” skew differs across markets. For example, index markets typically exhibit persistent negative skew, while some growth stocks or commodities may more often show positive skew. The key is to compare current skew levels against their historical norms.

Q: Where can I find free Option Skew data?

A: Professional data providers such as Bloomberg and Reuters offer detailed skew data, but they are expensive. For most investors, implied volatility data can be observed and reconstructed from option chains on financial websites (such as Barchart) or from derivatives exchanges like Deribit in the crypto market. Some advanced brokerage platforms also provide volatility curve tools for visual analysis.

Q: How is volatility smile analysis different from the VIX fear index?

A: The VIX index (volatility index) represents a “single aggregated level of implied volatility” for the S&P 500 over the next 30 days. It measures how much the market expects prices to move, but it does not indicate direction. In contrast, volatility smile and skew analysis show how implied volatility is distributed across different strike prices, revealing which direction the market is more concerned about (Bullish or bearish). In short, VIX tells you “how anxious the market is”, while skew analysis tells you “what the market is anxious about”.

Q: Is an extreme skew reading a buy or sell signal?

A: This is a common misconception. Extreme skew readings are best interpreted as a “contrarian sentiment indicator”. For example, extremely negative skew (where the market is heavily buying downside protection) may signal fear at or near a market bottom. Conversely, extremely positive skew (Market is extremely greedy) may indicate excessive optimism and potential topping conditions. Therefore, skew should not be used as a direct trading signal, but rather as a warning of extreme market sentiment when combined with other forms of analysis.


Conclusion

In summary, option skew analysis is not a perfect forecasting tool, but it is a powerful leading indicator. By learning how to interpret Option Skew and use the volatility smile to assess market conditions, investors can gain deeper insight into collective market expectations and sentiment, enabling more informed decision-making at critical moments. Integrating option skew analysis into your trading framework is an important step toward more professional investing and better risk management in volatile markets.

If you liked this article, please share it!

Related Articles

  • How to Buy Bitcoin in 2026: A Beginner’s Guide
    How to Get Started with Bitcoin? The Complete 2026 Bitcoin Buying Guide for Beginners After watching Bitcoin repeatedly reach new highs in recent years and successfully pass spot ETF reviews in the US and Hong Kong in 2024, officially entering mainstream financial markets, many investors have turned their attention to...
    2026 年 7 月 20 日
  • Gold V-Shaped Rebound: Bottom Signal or Bull Trap?
    Is Gold’s V-Shaped Rebound a Bottom-Fishing Signal? A Complete Guide to Trading Strategies Amid “$100 Price Swings” What Is a Gold V-Shaped Rebound? More Than Just a Technical Pattern The gold market has recently experienced sharp rises and falls, with prices frequently displaying dramatic “gold V-shaped rebounds”. Single-day “$100 price...
    2026 年 7 月 20 日
  • 2026 PPI Guide: PPI vs CPI and Stock Market Impact
    What Is PPI Data? 2026 Latest Analysis: Understand the Differences from CPI and How It Affects Stock Market Trends With market information constantly changing, do you always hold your breath while waiting for CPI data to be released? But did you know that a more forward-looking inflation indicator, PPI data...
    2026 年 7 月 20 日
返回顶部