Golden Cross Guide: MACD, Stocks & Trading Tips

Complete Guide to the Golden Cross: Detailed Explanation of MACD and Stock Golden Cross, 3 Tips to Select Stocks and Avoid False Signals
Want to accurately capture the best buying opportunities in the vast stock market but often feel overwhelmed by various complex technical indicators? The “Golden Cross” is a powerful trend reversal signal trusted by countless experienced investors, but do you truly understand the meaning of the golden cross behind it? Impulsively entering the market just because two lines cross may lead to false breakout traps. This article analyzes the core principles of the stock golden cross and MACD golden cross from a practical perspective and provides a systematic golden cross stock selection strategy to help you improve judgment accuracy and build positions steadily.
What Is a Golden Cross? Essential Definition for Beginners
In technical analysis, the “Golden Cross” is a widely recognized bullish signal indicating a potential transition from a bear to a bull market. It is more than just the intersection of two lines; it represents a shift in market momentum and is a key moment closely monitored by many trend traders.
Basic Principle of the Golden Cross: Short-Term MA vs Long-Term MA
The essence of a golden cross is a shorter-period moving average (MA) crossing above a longer-period moving average. Imagine a fast car representing short-term market sentiment overtaking a slow car representing long-term trend on a highway—this usually signals that short-term market momentum is strengthening and may drive a long-term upward trend reversal.
- Short-Term MA (Fast Line): Responds to recent price changes and is more sensitive, e.g., 5-day, 10-day, 20-day, 50-day MAs.
- Long-Term MA (Slow Line): Reflects longer-term price trends and is relatively smoother, e.g., 100-day, 200-day MAs.
The classic combination is the 50-day MA crossing above the 200-day MA, often considered a medium- to long-term bull market initiation signal.
Why is the Golden Cross a Strong Bullish Signal?
The golden cross is viewed as a strong signal because it embodies market psychology and capital flow logic. When the short-term MA breaks above the long-term MA:
- Trend Confirmation: Recent average buying costs surpass long-term average buying costs, indicating that bullish forces are gaining dominance.
- Market Confidence Strengthens: Rising prices attract more chasing buyers, forming a positive feedback loop.
- Support Emerges: The long-term MA after the crossover often shifts from a former resistance zone to a strong support zone, providing a buffer for price declines.
Golden Cross vs Death Cross: Key Differences at a Glance
To understand the golden cross, one must also consider its opposite: the Death Cross. They are completely opposite signals and help investors assess market conditions comprehensively. In short:

| Characteristics | Golden Cross |
Death Cross |
| Definition | Short-term MA Crosses Above Long-term MA | Short-term MA Crosses Below Long-term MA |
| Market Implication | Trend May Shift from Downward to Upward, Seen as a Buy or Bullish Signal | Trend May Shift from Upward to Downward, Seen as a Sell or Bearish Signal |
| Classic Combination | 50-Day MA Crosses Above 200-Day MA | 50-Day MA Crosses Below 200-Day MA |
| Investor Sentiment | Tends Toward Optimism, Market Confidence Recovers | Tends Toward Pessimism, Market Panic Spreads |
Practical Application of Golden Cross: From Moving Averages to MACD Indicator
Theory is important, but practice is the real test. The concept of the Golden Cross applies not only to moving averages (MA) but also has critical applications in another widely used indicator: MACD. Understanding the differences and uses of both can make your analytical toolkit more complete.
Moving Average (MA) Golden Cross: How to Set Parameters and Interpret?
When using MA Golden Cross, parameter settings are crucial, as different trading cycles require different MA combinations. Common settings include:
- Short-term trading: Focus on the crossover of 5MA and 20MA. Signals occur frequently but carry more noise, suitable for traders who respond quickly.
- Swing trading: Focus on the crossover of 20MA and 60MA (quarterly line) to capture mid-term trend reversals.
- Long-term investment: Focus on the crossover of 50MA and 200MA (yearly line). This is the classic combination used to judge long-term bull and bear market transitions. Although signals appear less frequently, once formed, trend reliability is very high.
When interpreting MA Golden Cross, pay attention to the angle at which the crossover occurs. If the short-term MA crosses sharply upward, it generally indicates strong upward momentum. Conversely, if the two MAs cross slowly at nearly parallel angles, the signal is relatively weak. For readers interested in different types and settings of moving averages, more in-depth teaching articles are recommended.
Further Reading (Highly Recommended)
SMA vs EMA vs WMA Ultimate Guide: Full Analysis of Moving Average Types, Which Fits Best…
MACD Indicator Tutorial|Understand Fast and Slow Lines, Histogram, Golden Cross and Divergence!
MACD Golden Cross: Practical Guide for DIF and MACD Lines
The MACD (Moving Average Convergence Divergence) indicator is essentially an extension of the moving average concept, so the Golden Cross concept also applies. The MACD Golden Cross refers to the fast line (DIF) crossing above the slow line (MACD, also called DEM or Signal Line) on its chart.
- DIF Line (Fast Line): Represents the difference between short-term and long-term EMAs, reacts quickly.
- MACD Line (Slow Line): The moving average of the DIF line, reacts more slowly.
Compared with MA Golden Cross, MACD Golden Cross signals appear earlier because it calculates the “difference value”, making it more sensitive to price changes. This makes it an effective tool for capturing early trend reversals. Especially when the DIF line crosses the MACD line below the zero axis, it is generally considered a more reliable bottom reversal signal. For a deeper understanding of MACD applications, see this complete MACD indicator tutorial.

How to Use the Golden Cross for Stock Selection? 3-Step Practical Strategy to Filter Potential Stocks
After mastering the theory, the next step is applying the Golden Cross in actual stock selection. An effective strategy does not rely solely on one indicator but requires multi-dimensional verification.

- Step One: Preliminary Screening Using Tools
Most brokerage trading software or financial websites have built-in “technical indicator stock selection” functions. You can set conditions such as “today 50MA crosses above 200MA” or “MACD daily Golden Cross” to quickly filter thousands of stocks that meet the criteria. - Step Two: Observe Volume and K-Line Patterns
This is the key step to filter out “false signals”. A truly effective Golden Cross is usually accompanied by:- Increased Volume: During the days around the crossover, volume rises significantly, indicating large funds entering, which increases the reliability of the signal. For volume analysis, see authoritative volume analysis tutorials.
- Bullish K-Line Patterns: Such as long bullish candles or hammer lines with lower shadows, showing strong buying pressure.
- Step Three: Examine Fundamentals and Market Trends
Stocks selected by technical analysis are best supported by fundamentals. Briefly check whether the company’s revenue is growing and whether it belongs to a trending industry. If a stock shows a Golden Cross but its fundamentals are deteriorating, the crossover is likely just a temporary rebound rather than a trend reversal.
Golden Cross FAQs
Q: Will the stock price definitely rise after a Golden Cross appears?
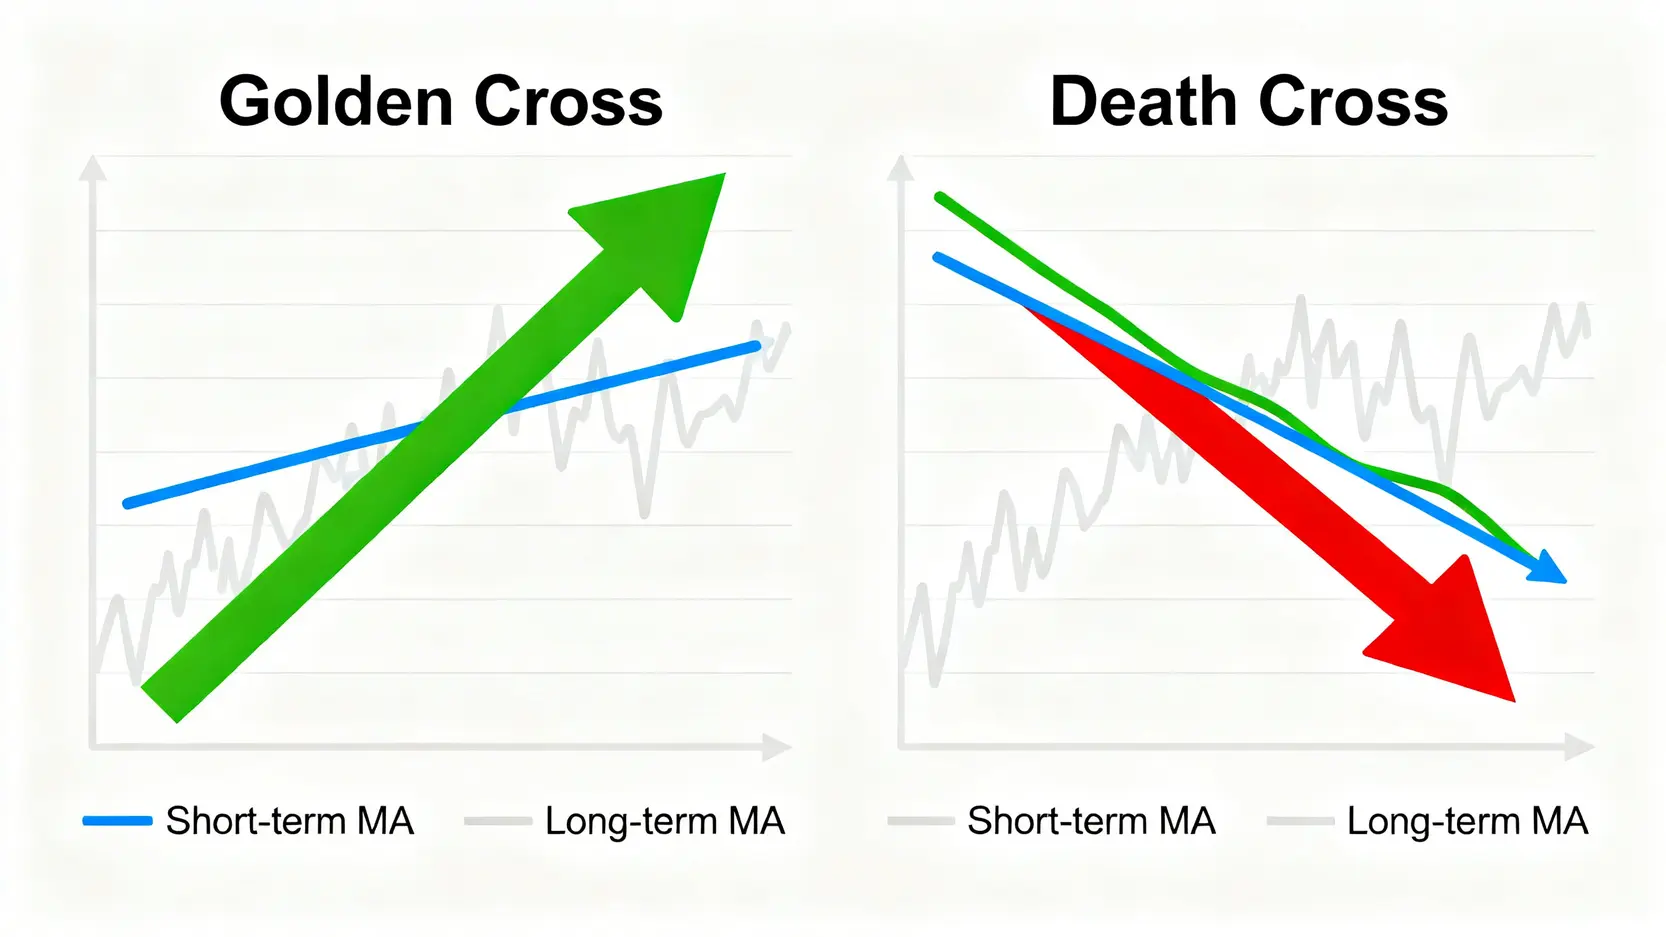
A: Not necessarily. No technical indicator is 100% accurate. Golden Cross is a “probability-based” signal derived from historical data, indicating a higher likelihood of future price increase but not a guarantee. In consolidating markets, short-term and long-term MAs may cross frequently, producing many invalid “false signals”. Therefore, it must be combined with volume, overall market trends, and other factors for comprehensive judgment.
Q: Which is more reliable, MACD Golden Cross or Moving Average Golden Cross?
A: It depends on your trading strategy and time frame. MACD Golden Cross is more sensitive, providing earlier signals, suitable for short-term or swing traders seeking early entry points, but it also produces more false signals. MA Golden Cross (especially long-term like 50/200MA) appears later but once formed, indicates a long-term trend with higher stability, making it more suitable for long-term investors.
Q: Is Golden Cross strategy applicable to all stocks or markets?
A: No. Trend indicators such as the golden cross perform best in markets with clear upward or downward trends. In sideways, “range-bound markets” without a clear direction, or in illiquid stocks with very low trading volume, their effectiveness is significantly reduced. Generally, they are more suitable for large-cap, highly liquid blue-chip stocks or index ETFs.
Q: What is the optimal time frame for Golden Cross?
A: This also depends on your trading style. Long-term investors focus on “daily charts” with 50-day and 200-day MA Golden Crosses, which have the strongest trend significance. Swing traders may observe 20/60MA crossovers on “daily charts” or 5/20MA crossovers on “weekly charts”. Intraday or short-term traders use “hourly” or even “15-minute charts”, but the shorter the period, the lower the signal stability
Conclusion
In summary, whether using stock moving averages or MACD indicators, the Golden Cross is a highly valuable technical analysis tool that helps you identify market shifts from bearish to bullish. However, it is not a guaranteed profit signal. A mature investor should view the Golden Cross as an auxiliary decision-making tool, not the sole basis for entry. Combining it with volume analysis, fundamental evaluation, and overall market sentiment can create a more robust and higher-probability trading system. Start applying the Golden Cross stock selection strategy now to enhance the quality of your investment decisions.
Related Articles
-
Practical Applications of Volatility Surfaces: From Options Modeling to Advanced Skew Trading Strategies In options markets, implied volatility is never a flat line. Instead, it forms complex "smile" or "skew" surfaces. For advanced traders, mastering the practical applications of volatility surfaces is equivalent to possessing a lens that reveals market...2026 年 6 月 3 日
-
Building a Foreign Capital Flow Copy Trading Model: A Stock Market Indicator for Accurately Tracking Institutional Positioning In Asia-Pacific stock markets, foreign capital inflows and outflows often determine the direction of the index. However, simply looking at daily net buy and sell data is no longer enough. Only by building...2026 年 6 月 3 日
-
Options Buyer Strategies During Extreme Market Conditions: Black Swan Hedging and Cross-Market Arbitrage During Volatility Surges The most terrifying aspect of financial markets is not a gradual decline, but overnight flash crashes and cross-market capital withdrawals accompanied by volatility surges. In the highly unpredictable global macroeconomic environment of 2026, geopolitical...2026 年 6 月 3 日


