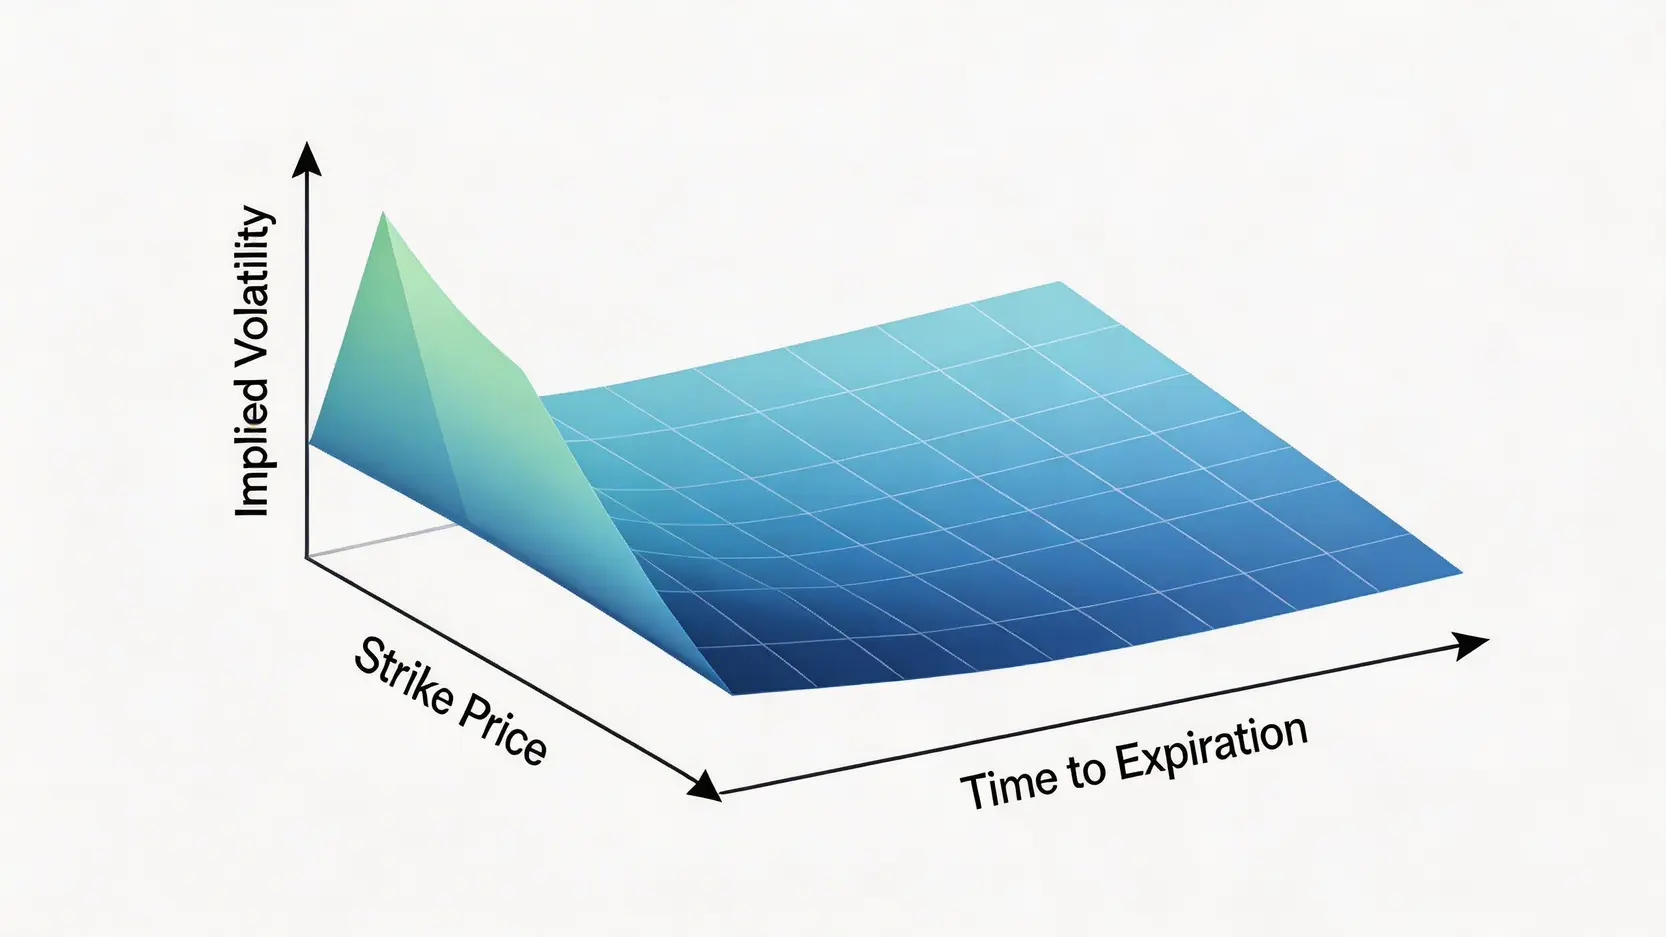
Figure 3: From Volatility Smile to the Three-Dimensional Volatility Surface
This 3D surface allows traders to view the entire implied volatility structure at once, analyzing not only market sentiment at a given time (skew), but also expectations of volatility across different maturities (term structure).
Practical Analysis: 3 Steps to Interpret the Volatility Surface and Predict Market Trends
When analyzing the volatility surface, you can follow these three steps to extract meaningful insights:
Step 1: Cross-Section Analysis (Volatility Smile/Skew)
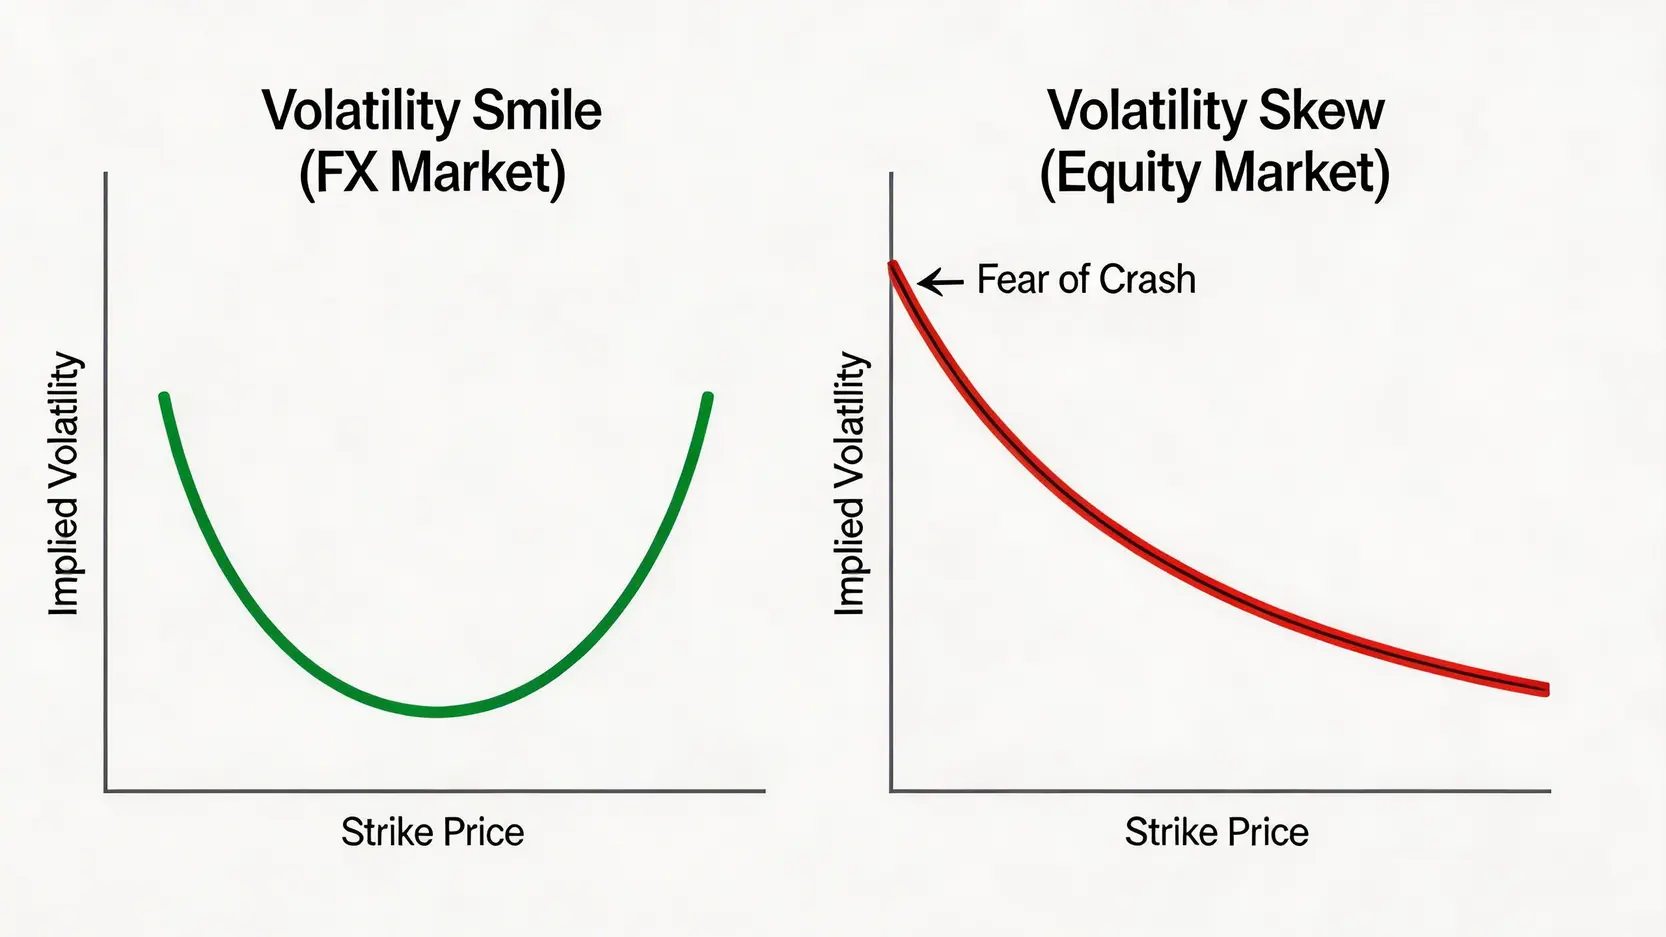
Fix one expiration date and observe how implied volatility changes across strike prices. This is the Volatility Skew discussed earlier. The goal is to assess current market risk sentiment.
Step 2: Vertical Analysis (Term Structure)
Fix one strike price (usually ATM) and observe implied volatility across different expirations. This forms the volatility “term structure”.
- Normal Market (Contango): Near-term IV is lower than long-term IV, and the curve slopes upward. This reflects higher expected future uncertainty.
- Stress Market (Backwardation): Near-term IV is higher than long-term IV, and the curve slopes downward. This typically occurs during sudden market shocks or before major data releases, indicating elevated short-term fear.
Step 3: Integrated Analysis (Identifying Anomalies)
View the entire surface as a whole and look for abnormal “spikes” or “dips”. These anomalies may indicate that the market has significantly different volatility expectations for specific events (such as earnings announcements or central bank meetings) which can create opportunities for skew trading strategies.
Core Applications: 3 Volatility Skew Use Cases and Skew Trading Strategies
Understanding theory is only the beginning. The real value lies in application. Mastering Volatility Skew applications allows your trading strategies to become more diversified and precise.
Strategy 1: Risk Management and Hedging, Using Skew to Protect Your Portfolio
For investors holding large stock positions or fund managers, monitoring volatility skew is an essential part of portfolio risk management. When skew steepens sharply, it is a strong warning signal that downside risk concerns are rising. Actions include:
- Buying puts: The most direct hedge, acting as insurance for your portfolio.
- Collar strategy: Buying puts while selling calls. The premium received from calls helps offset the cost of puts, limiting downside risk at the expense of upside potential.
Strategy 2: Skew Spread Trading to Capture Arbitrage Opportunities
The core idea of skew trading strategies is to trade the “skew” itself, rather than simply betting on direction. Traders use spread structures to express views on future skew changes.
For example, if you expect market fear to ease and skew to flatten (meaning OTM put IV declines relatively), you can construct a “bearish skew” position:
| Strategy |
Execution |
Objective
|
Suitable Scenarios |
| Risk Reversal (Risk Reversal) |
Sell an out-of-the-money put (Sell OTM Put), while buying an out-of-the-money call (Buy OTM Call) |
Bet on a decline in skew, meaning the relative value of put options will decrease while the relative value of call options will increase. |
Expect the market to shift from fear to optimism, or when volatility skew is at an historically elevated level. |
The profit from this type of trade comes from changes in the shape of the volatility curve. Even if the underlying asset price does not move significantly, as long as the skew evolves as expected, the trader can still make a profit.
Strategy 3: Identifying Extreme Market Sentiment and Deploying Black Swan Event Trading Strategies
Volatility skew provides clues for trading “black swan” events. When skew is at an extremely low level, it indicates that the market is extremely complacent and no one expects a sharp decline. At this point, buying deep out-of-the-money put options is relatively cheap, like purchasing a “lottery ticket”. If an unexpected market crash does occur, the value of these options can increase by tens or even hundreds of times.
Conversely, when skew is at an historically high level, it indicates extreme market fear, and out-of-the-money put options are overpriced. Contrarian investors may consider selling these expensive puts (for example, constructing a Bull Put Spread) to collect excess premium generated by excessive fear in the market. Of course, this strategy carries extremely high risk and requires strict risk management.
Further Reading (Highly Recommended)
How Do Options Work? A Beginner’s Guide to Options Trading and 4 Core Strategies (2025 Tutorial)
What Are ETF Risks? A Complete Breakdown of ETF Risk Levels and Investment Management Strategies
Frequently Asked Questions About Volatility Surface Analysis (FAQ)
Q: What does a larger Volatility Skew indicate?
A: In index options, a steeper (left) skew generally indicates higher risk aversion in the market. It means traders are willing to pay higher prices for put options to hedge downside risk, causing lower strike implied volatility to be significantly higher than higher strike implied volatility. In simple terms, a steep skew curve is a direct reflection of market fear.
Q: What tools are needed for volatility surface analysis?
A: Professional trading platforms usually provide volatility analysis tools. For example, trading software from major brokers (such as TWS of Interactive Brokers), or professional options analytics platforms (such as OptionVue and Thinkorswim) can plot volatility smile curves and 3D volatility surfaces. For retail investors, financial data websites (such as the CBOE official site) also provide volatility skew data for major indices.
Q: Is skew trading suitable for beginners? What are the risks?
A: Skew trading strategies are relatively advanced options techniques and are not suitable for beginners. The main risk is that it involves not only predicting the direction of the underlying asset, but also understanding complex volatility dynamics. Even if you correctly predict the direction of skew, large adverse price movements in the underlying asset can still lead to significant losses. It is recommended to try such strategies with small capital only after fully mastering basic options strategies.
Q: What is “term structure” in the volatility surface?
A: Term structure is an important dimension of volatility surface analysis, showing the relationship between implied volatilities of options with different expirations. Under normal conditions, longer-dated options tend to have higher implied volatility than near-term options (known as contango), because longer time horizons carry greater uncertainty. However, during market stress, near-term volatility may spike above long-term volatility (known as backwardation), which is a strong signal of market stress.
Conclusion
In summary, mastering techniques from the “volatility smile” to “volatility surface analysis” is a key milestone for options traders transitioning from beginner to professional level. This analytical framework goes beyond simple price prediction, allowing you to understand deeper market emotions such as fear and greed, thereby improving risk assessment, optimizing hedging strategies, and identifying unique trading opportunities that cannot be seen through traditional technical or fundamental analysis. Once you begin learning and applying “skew trading strategies”, your trading decisions will be based on a more structured and comprehensive understanding of the market, giving you a stronger competitive edge.