2026 Bond Yield Full Guide: US Treasury Trends, Inversion Analysis, and Bond ETF Allocation
In the vast ocean of the investment market, whether you prefer the dramatic waves of the stock market or the steady reliability of fixed income, there is one core indicator that no market participant can ignore, and that is bond yield. It is not only the basis for evaluating the investment return of a single bond, but also the “gravitational force” that drives global capital flows and the pricing of various assets. As the macroeconomic environment continues to evolve in July 2026, the pace of monetary easing by major global central banks has become the focus of the market. Every slight movement in US Treasury yields is testing capital flows and investors’ nerves. Many investors are participating in this wave through investment tools such as bond ETFs, but if they do not understand the operating logic and historical context behind yields, they can easily lose direction amid sharp volatility. This article will take you through an in-depth breakdown of this core code of the financial market and help you grasp the key to steady returns.
What Is Bond Yield? From Basic Concepts to the Price Seesaw Effect
To truly understand the operating logic of the bond market, we must first clarify the essential difference between “coupon rate” and “bond yield”. These two concepts often confuse investors who are new to the fixed income market, but they are the two major pillars that determine investment returns.
A bond is essentially an IOU. When you buy a bond, it is equivalent to lending money to the issuer (such as a government or a large corporation). The issuer promises to pay interest regularly within a specific period and repay the principal in full at maturity. The interest percentage that is fixed at issuance and will not change no matter how the market fluctuates is called the coupon rate. For example, a government bond with a face value of 100,000 and a coupon rate of 4% will pay a fixed annual interest of 4,000, without change.
However, bonds are publicly traded every day in the secondary market, and their prices fluctuate at any time with market supply and demand, inflation expectations, and central bank policies. This gives rise to the most critical indicator: yield to maturity (YTM), which is also the bond yield we often hear about in financial news.
Suppose market interest rates rise sharply, allowing newly issued government bonds to offer 5% interest. In that case, the old bond that originally paid only 4% interest would lose its appeal. To sell it successfully, the holder of the old bond would have to sell it at a discount, perhaps lowering the price to 95,000. If you buy this bond at 95,000 at that moment, you will still receive 4,000 in interest every year, and you can also recover the face value principal of 100,000 when holding it to maturity. This additional 5,000 in capital gain will raise your actual annualized return to nearly 5%. This real rate of return, which combines current interest income and future capital gains (or losses) and annualizes the result, is bond yield.
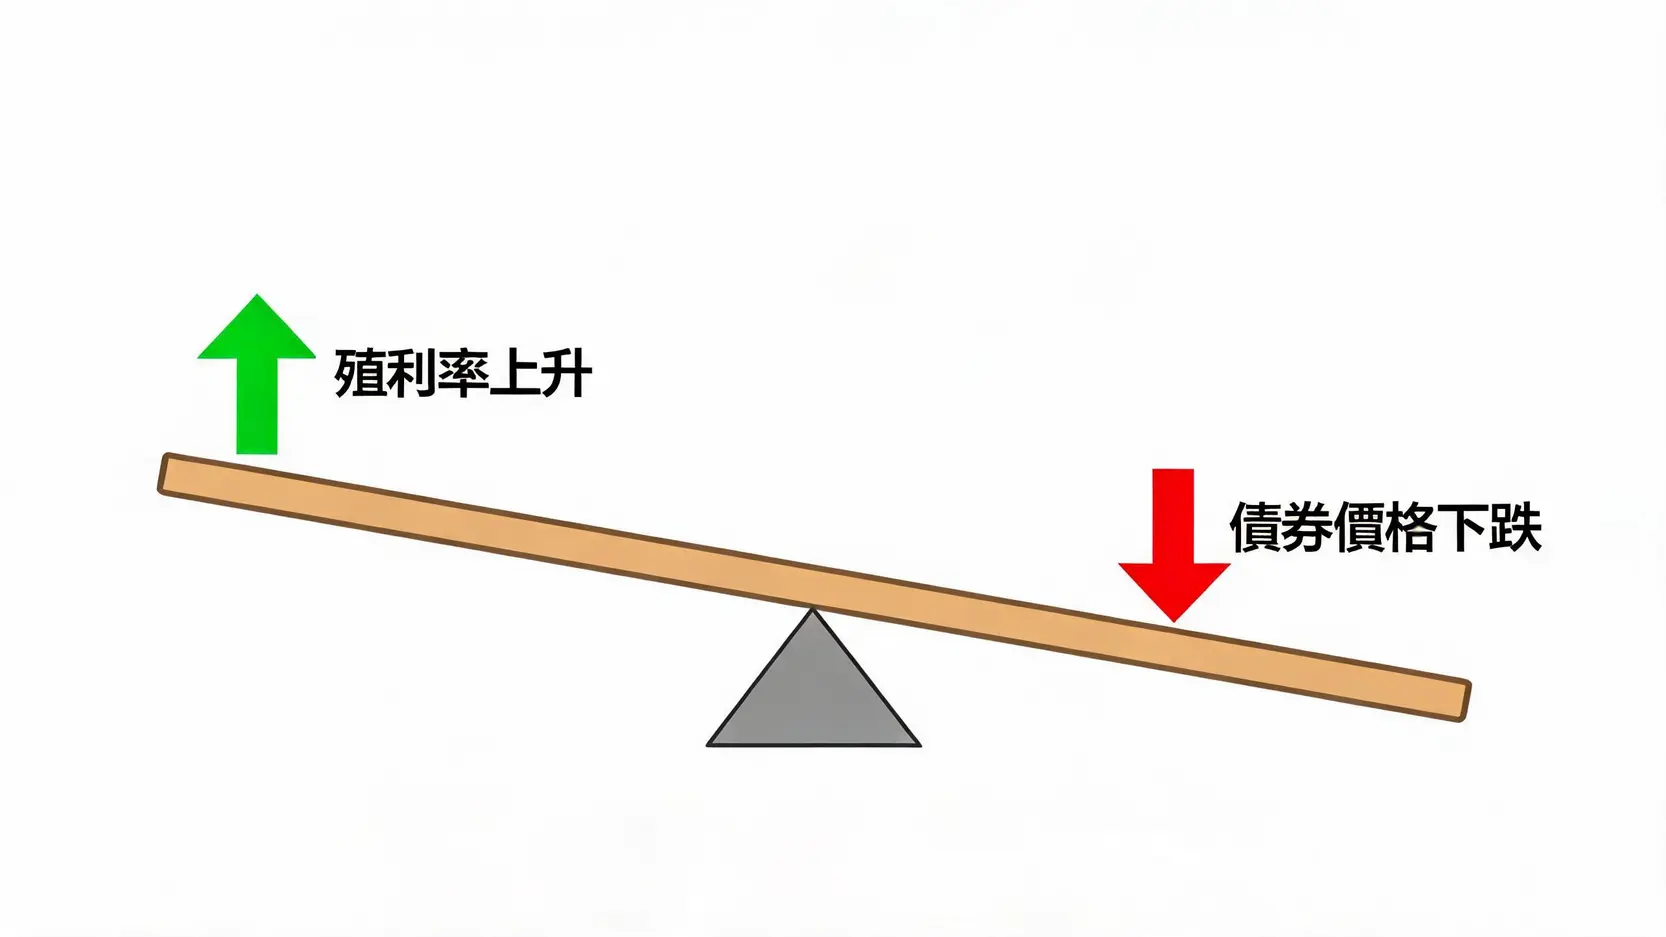
From this, it can be seen that there is an absolute inverse “seesaw effect” between bond prices and yields. When yields rise, bond prices fall; when yields fall, bond prices rise. This is the most fundamental rule in fixed income.
Illustration: The Inverse “Seesaw” Relationship Between Bond Prices and Yields
Indicator Name
Definition and Characteristics
Does It Change With the Market?
Coupon Rate
The interest rate agreed upon at issuance, calculated based on the bond’s face value.
No, fixed for life.
Current Yield
Annual interest received divided by the current market purchase price. Does not take into account gains or losses on the principal at maturity.
Yes, it changes with the purchase price.
Yield to Maturity (YTM)
The annualized total return calculated by combining coupon interest and the difference between the purchase price and face value when held to maturity.
Yes, it fluctuates daily with market quotes.
Four Core Factors Determining the Direction of US Treasury Yields
Among all bonds, Treasury bonds issued by the US federal government are globally recognized as assets with extremely low default probability, backed by the credit of the US government. Therefore, US Treasury yields (especially the 10-year Treasury yield) are regarded as the “risk-free rate” of global financial markets. It is not only the benchmark for mortgage rates and corporate bond issuance costs, but also an extremely important discount rate parameter in stock market valuation models. To accurately interpret this indicator, you must closely examine the following four major factors:
Monetary policy of the Federal Reserve (Fed): The central bank’s benchmark interest rate is the source of market funding costs. When the Federal Reserve begins raising rates, short-term Treasury yields are the first to surge. Conversely, when entering a monetary easing cycle such as the current environment in 2026, short-end rates will fall rapidly, thereby driving the entire yield curve lower.
Inflation expectations: Inflation is the biggest enemy of all fixed income assets. If you lock in a 4% long-term return today, but the future inflation rate reaches 5%, it means your real purchasing power is shrinking. Therefore, when inflation expectations rise, investors will sell bonds and demand higher yields to compensate for inflation risk.
Market risk-off sentiment: Capital always shifts between efficiency and safety. When the economy is booming, capital flows into the stock market in pursuit of higher risk and higher returns. However, when geopolitical conflicts or recession concerns arise, large amounts of capital rush into US Treasuries as a safe haven, with buying demand pushing up bond prices and thereby lowering yields.
Supply and demand positioning and fiscal policy: In recent years, the US government has run high fiscal deficits, and the Treasury Department has had to continuously issue large amounts of new debt to raise funds. When bond supply becomes too large and exceeds market absorption capacity, the government must offer higher yields to attract buyers. To stay on top of the most timely data, professional investors usually closely follow the Daily Treasury PAR Yield Curve Rates released by the US Treasury Department.
In-Depth Analysis of the Link Between Yield Curve Inversion and the Economic Cycle
If you continuously follow financial news, you must be familiar with the term “yield curve inversion”. To understand inversion, you must first understand the “yield curve”.
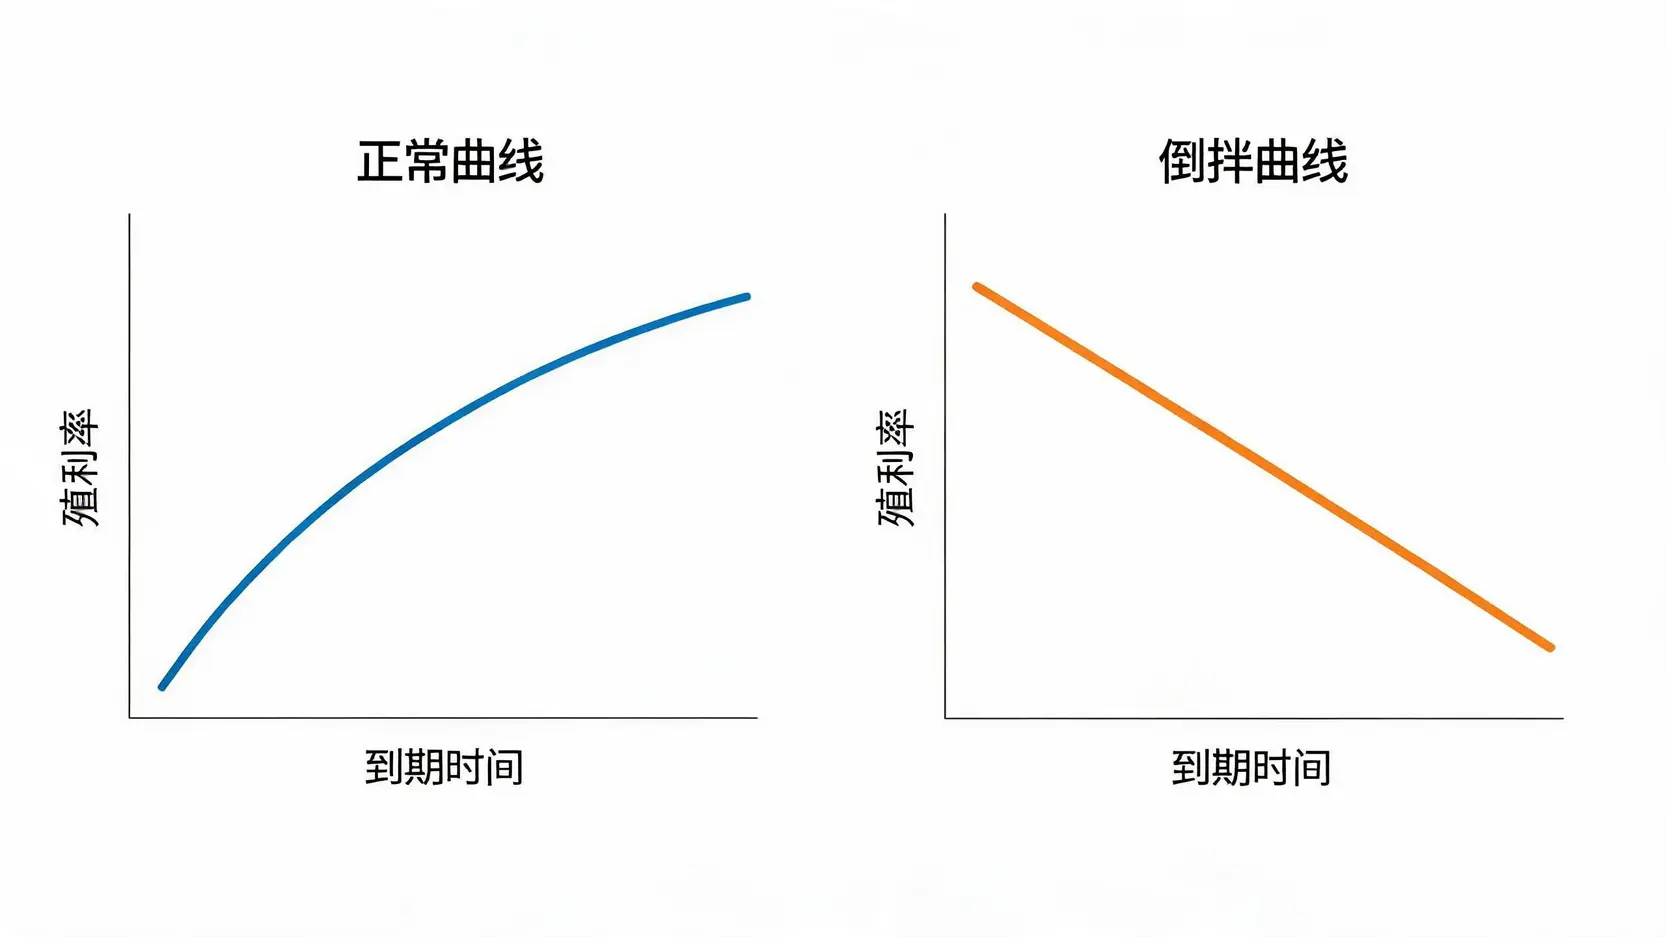
Under normal circumstances, the longer the borrowing period, the longer capital is locked up, and the higher the uncertainty related to inflation and default. Therefore, long-term bonds (such as 10-year and 30-year bonds) should have higher yields than short-term bonds (such as 3-month and 2-year bonds). Connecting yields of different maturities into a line forms a normal “upward-sloping” curve.
However, when the macroeconomic environment becomes abnormal, for example when the central bank raises short-term benchmark rates very high to curb inflation, while the market also expects high interest rates to trigger a future recession and force the central bank to cut rates sharply later to support the economy, long-term yields will fall sharply in advance, causing short-term yields to become higher than long-term yields. This is known as “yield curve inversion”. The most closely watched indicator in the market is the spread between 2-year and 10-year US Treasury yields.
Normal Yield Curve vs. Yield Curve Inversion
Looking back at financial history over the past few decades, yield curve inversion has almost always been the “canary in the coal mine” that appears before every economic recession. However, experienced market participants know that inversion itself does not immediately trigger a crash. From the appearance of inversion to an actual economic recession, there is often a time lag ranging from several months to more than a year and a half. In addition, when the yield curve shifts from inversion to “steepening” (meaning short-end rates fall rapidly due to central bank rate cuts while long-end rates stay steady or decline slowly), this is usually the critical moment when the economy is truly under pressure and the stock market experiences sharp volatility. Investors should closely monitor this transition period and review whether the defensive strength of their asset allocation is sufficient.
US Treasury Yield Trends and Investment Strategies During a Rate-Cut Cycle
As we move into the second half of 2026, the global economy has clearly felt the cooling effect brought by previous tightening policies, and major central banks are steadily advancing monetary easing. Against this backdrop, US Treasury yield trends are showing very different dynamics. For fixed income investors, this is a period full of opportunities, but also one that contains hidden volatility.
In a rate-cut environment, rising bond prices are an inevitable trend. At this point, the core of investment strategy lies in flexibly using “duration”. Duration is a key indicator that measures how sensitive bond prices are to interest rate changes. Simply put, if a bond portfolio has a duration of 15 years, it means that when market yields fall by 1%, the portfolio’s price will rise by approximately 15%. Conversely, if yields rebound by 1%, the price will also face a 15% drawdown.
💡 Practical Strategy Analysis:
Capital gain seekers: If you strongly expect long-term interest rates to decline further, positioning in Treasury bonds with maturities of over 20 years can maximize the price surge benefits brought by rate cuts.
Steady income investors: If you are worried that long-term bonds are too volatile, or concerned that inflation stickiness may keep long-end rates elevated, you can adopt a “barbell strategy”. Hold very short-term Treasuries on one side to lock in relatively high interest income and preserve principal, while allocating part of the portfolio to long-term bonds on the other side to participate in capital gains, balancing risk and return.
It is worth noting that investment markets never move in a straight line. If data shows that the economy is unexpectedly strong, rate-cut expectations may be revised by the market at any time, triggering short-term turbulence in the bond market. If you want to further understand the underlying logic and response plans when facing severe market volatility, it is recommended to refer to this in-depth analysis article: Full Analysis of Why US Treasuries Fell Sharply: Essential Risk-Hedging and Positioning Strategies for Investors.
Practical Guide: How to Choose Suitable Bond ETFs and Investment Portfolios?
For most investors, directly opening an overseas account to buy and sell individual US Treasuries not only involves a high capital threshold, but liquidity and transaction fees are also major challenges. Therefore, participating in the fixed income market through listed bond ETFs has become today’s most mainstream and efficient investment tool. Through ETFs, you only need a small amount of capital to buy a basket of bonds carefully selected by professional institutions, instantly achieving an extremely high level of risk diversification.
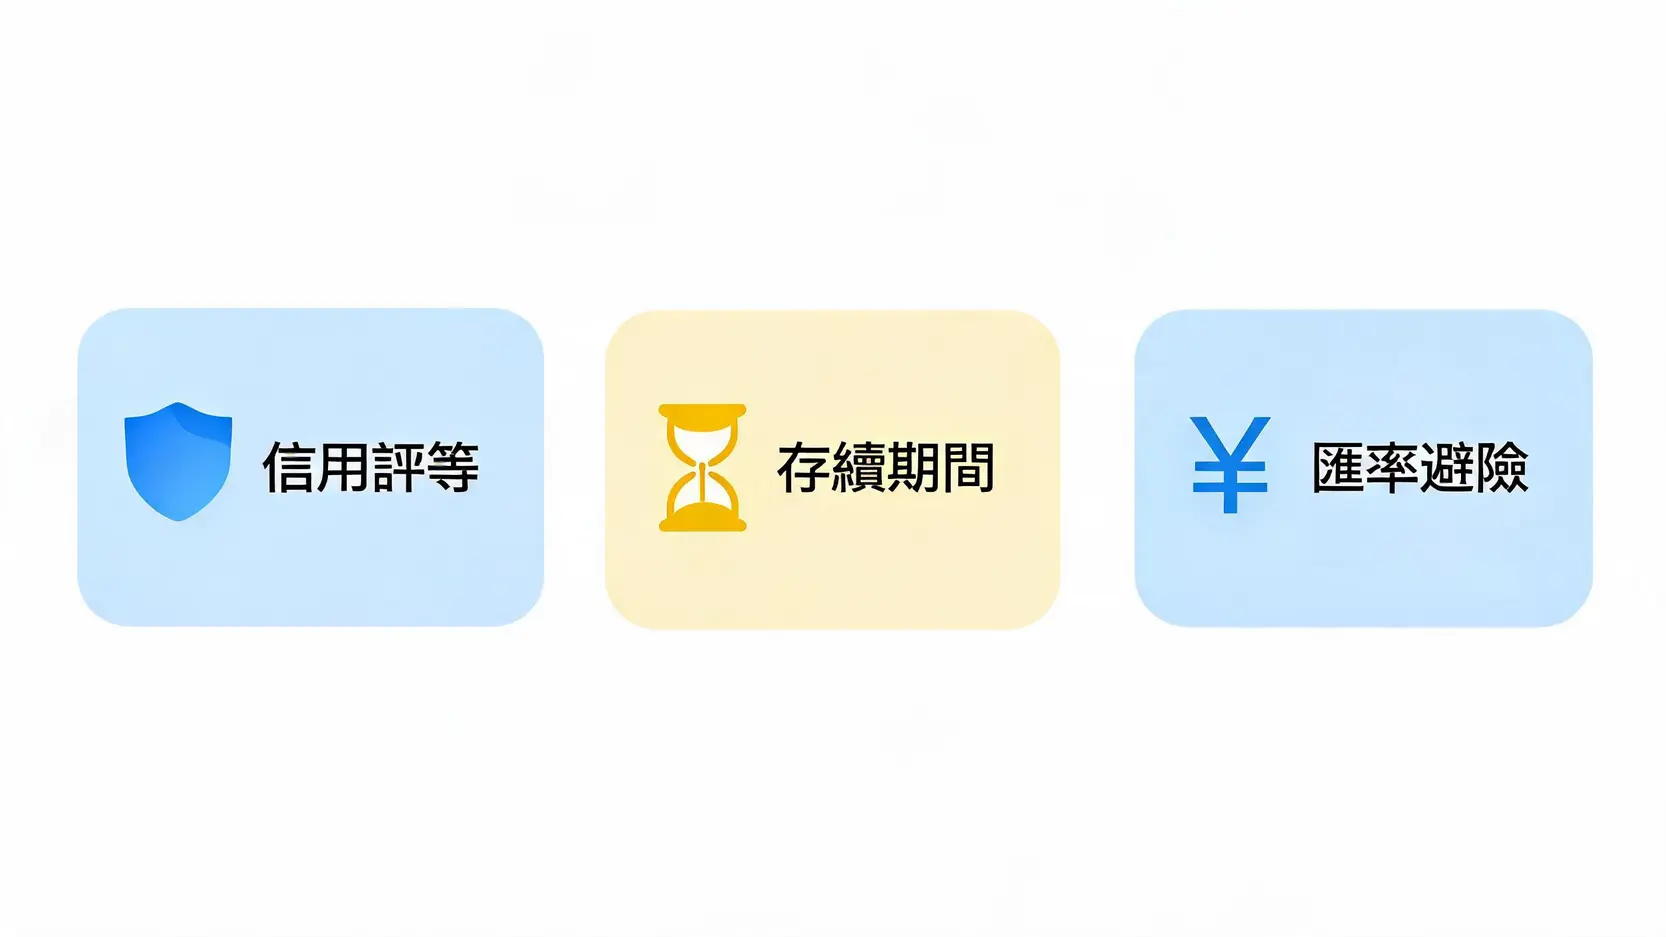
With the wide variety of bond ETFs available in the market, how should investors choose? They can evaluate them from the following three dimensions:
Three Core Evaluation Dimensions for Selecting Bond ETFs
Credit rating and bond type: US Treasury ETFs have almost zero default risk and are tools that purely reflect interest rate trends. Investment-grade corporate bond ETFs (such as those rated A, BBB, or above) provide additional “credit spreads”, meaning the extra interest companies offer to compensate for default risk. When the economy is stable, corporate bonds provide richer distributions. However, during recession panic, corporate bonds may be sold off along with the stock market, which requires caution.
Target maturity and duration: As mentioned in the previous section, choose long-term products if you want to earn capital gains, and choose short-term products if you want stable income and a place to park funds. There are many products in the market with clearly labeled maturities, such as “20+ Year US Treasury ETFs” or “1-3 Year US Treasury ETFs”. If you want to further study the differences among various maturities and issuers, this detailed Ultimate Guide to Taiwan Bond ETFs: Full Guide to Yuanta US Treasuries, Investment-Grade Bonds, and Stable Positioning can provide you with a clear product blueprint.
Currency hedging mechanism: If you buy an unhedged foreign currency-denominated bond ETF, when local currencies such as the New Taiwan dollar appreciate sharply, foreign exchange losses may very likely consume the interest income you worked hard to earn. Therefore, in different exchange rate cycles, whether to choose an ETF with a hedging mechanism is an important key to protecting returns.
Conclusion
Bond yield is not merely a cold number in financial news. It is the pulse of global financial markets. Mastering its operating patterns is equivalent to obtaining the key to unlocking the code of global asset rotation. Whether you want to capture capital gains during a monetary easing cycle through long-term Treasuries, or build steady cash flow that is less affected by market turbulence through short-term products, understanding the core logic that “yields and prices move inversely” is always the first step toward successful investing. Facing the complex and ever-changing macroeconomic and geopolitical environment of 2026, no investment tool can guarantee profits forever. Only by staying rational, continuously absorbing accurate information, and flexibly adjusting your investment portfolio according to your own risk tolerance can you preserve gains, maintain stability, and steadily accumulate wealth amid sharp market volatility.
Frequently Asked Questions (FAQ)
Q: What Is Bond Yield?
Bond yield (Yield to Maturity) is the annualized real rate of return that investors can obtain by buying a bond at the current market price and holding it to maturity. It not only includes the fixed coupon interest received each year, but also factors in the capital gain or loss between the purchase price and the face value at maturity. It is the most realistic and critical indicator for assessing the investment value of fixed income assets.
Q: What Is the Relationship Between Bond Yield and Bond Price?
The two have an absolute inverse “seesaw” relationship. When market yields rise, it means new investment opportunities with better returns can be found in the market. The fixed interest of existing bonds becomes less attractive, so their prices must fall to attract buyers. Conversely, when market yields fall, the high interest of existing bonds becomes highly sought after, and prices naturally rise accordingly.
Q: Is Now a Good Time to Buy Bond ETFs?
As central banks continue advancing monetary easing policies in 2026, the overall downward trend in interest rates is undoubtedly favorable for bond price performance. However, financial markets are often forward-looking and may have already priced in a considerable degree of rate cut expectations in advance. Investors should avoid blindly making a heavy bet in one direction. It is recommended to reasonably allocate long- and short-duration bond ETFs according to their own funding timeline and risk tolerance, building an investment portfolio that balances offense and defense.
Q: Why Does Everyone Pay Close Attention to the US 10-Year Treasury Yield?
The US 10-year Treasury yield is widely recognized as the anchor standard for the “risk-free rate” in global financial markets. It not only directly affects mortgage rates, credit card revolving interest, and corporate borrowing costs, but is also a core parameter in various asset valuation models, such as the discount rate used to calculate the intrinsic value of stocks. Sharp fluctuations in it will inevitably trigger repricing across global stock, foreign exchange, and commodity markets.
Q: What Is Yield Curve Inversion? What Does It Mean?
Under normal economic conditions, long-term bonds should have higher yields than short-term bonds because they carry higher risks. When short-term yields abnormally exceed long-term yields, this is known as “yield curve inversion”. This usually reflects market anxiety over short-term liquidity tightening and pessimistic expectations for the long-term economic outlook. In historical data, it has often been regarded as a strong leading indicator that the economy is about to enter a recession.
Unable to Borrow Money Through Stock Pledge Loans? Uncovering Brokerage Funding Shortages and the FSC’s Deleveraging Policy When you urgently need funds or want to add to your positions, but do not want to sell your high-quality holdings, what should you do? “Stock pledge” is the secret weapon that helps...
What Is Stock Lending? A Guide to Earning Interest on Idle Stocks, Asset Activation Strategies Every Dividend Investor Should Learn, and a Full Breakdown of Brokerage Settings Are the stocks in your hands stuck in long-term losses, or are you holding quality stocks that you are reluctant to sell? Instead...
What Is the Gold Price per Mace? How Heavy Is One Tael? A Super Practical Gold Unit Conversion Table In physical gold trading, quotes such as “gold price per mace: NT$XXX” are common. Being familiar with gold weight unit conversions and how gold shops calculate prices is the foundation of...