SMC Liquidity Hunting: Institutional Strategy Guide

Updated: 2026/04/28  |  CashbackIsland

smc-liquidity-grab-strategy

SMC Liquidity Hunting Strategy: 5 Steps to Understand Institutional Positioning and Stop Getting Easily Stop-Loss Hunted

Do you often encounter this situation: you clearly got the direction right, but your stop-loss is always precisely hit, and then price moves straight in the direction you originally expected? This is very likely not bad luck, but a case of “liquidity hunting”. Behind this phenomenon lies a complete liquidity hunting strategy, a common method used by institutional players (or smart money) to harvest retail traders. From an SMC liquidity education perspective, this article will break down the meaning of stop-loss hunting in a simple way and provide a complete practical framework to help you identify traps and even use this phenomenon to your advantage, so you can stop being preyed upon by institutions. 


What Is Liquidity Hunting (Stop Hunt)? Understanding Institutional Positioning

Liquidity hunting (also known as Liquidity Grab or Stop Hunt), often referred to as “stop-loss sweeping”, describes a practice where large institutions or market makers deliberately push price into areas where retail traders have placed stop-loss orders, in order to gain the liquidity needed to execute large positions.


Basic Meaning of Liquidity: Buy-Side vs Sell-Side Liquidity

Before understanding liquidity hunting, you must first understand what “liquidity” means. In simple terms, liquidity refers to orders in the market, and it is divided into two types:

  • Buy-side liquidity: This refers to clusters of “buy stop orders” or “buy limit orders”. Buy stop orders are typically placed above obvious resistance levels or previous swing highs. When price rises into these levels, these buy orders are triggered.
  • Sell-side liquidity: This refers to clusters of “sell stop orders” or “sell limit orders”. Sell stop orders are usually placed below obvious support levels or previous swing lows. When price falls into these levels, these sell orders are triggered.

These clustered order zones are essentially “liquidity pools” in the market, waiting to be activated.


Why Do Institutions Need to “Hunt” Your Stop-Loss? The Truth Behind the Market

Imagine an institutional trader who wants to build a multi-hundred-million-dollar short position. If he simply sells heavily into the market, price would collapse instantly due to the selling pressure, causing poor execution and “slippage”.

To avoid this, he needs counterparties to absorb his orders. Retail traders’ buy stop-loss orders above resistance become ideal targets. By slightly pushing price upward, these stop orders are triggered and become buy orders, providing liquidity for the institution to execute large sell positions smoothly.  This is the core reason behind stop-loss hunting: Large players need liquidity to enter and exit positions, and retail stop-loss orders provide exactly that liquidity.


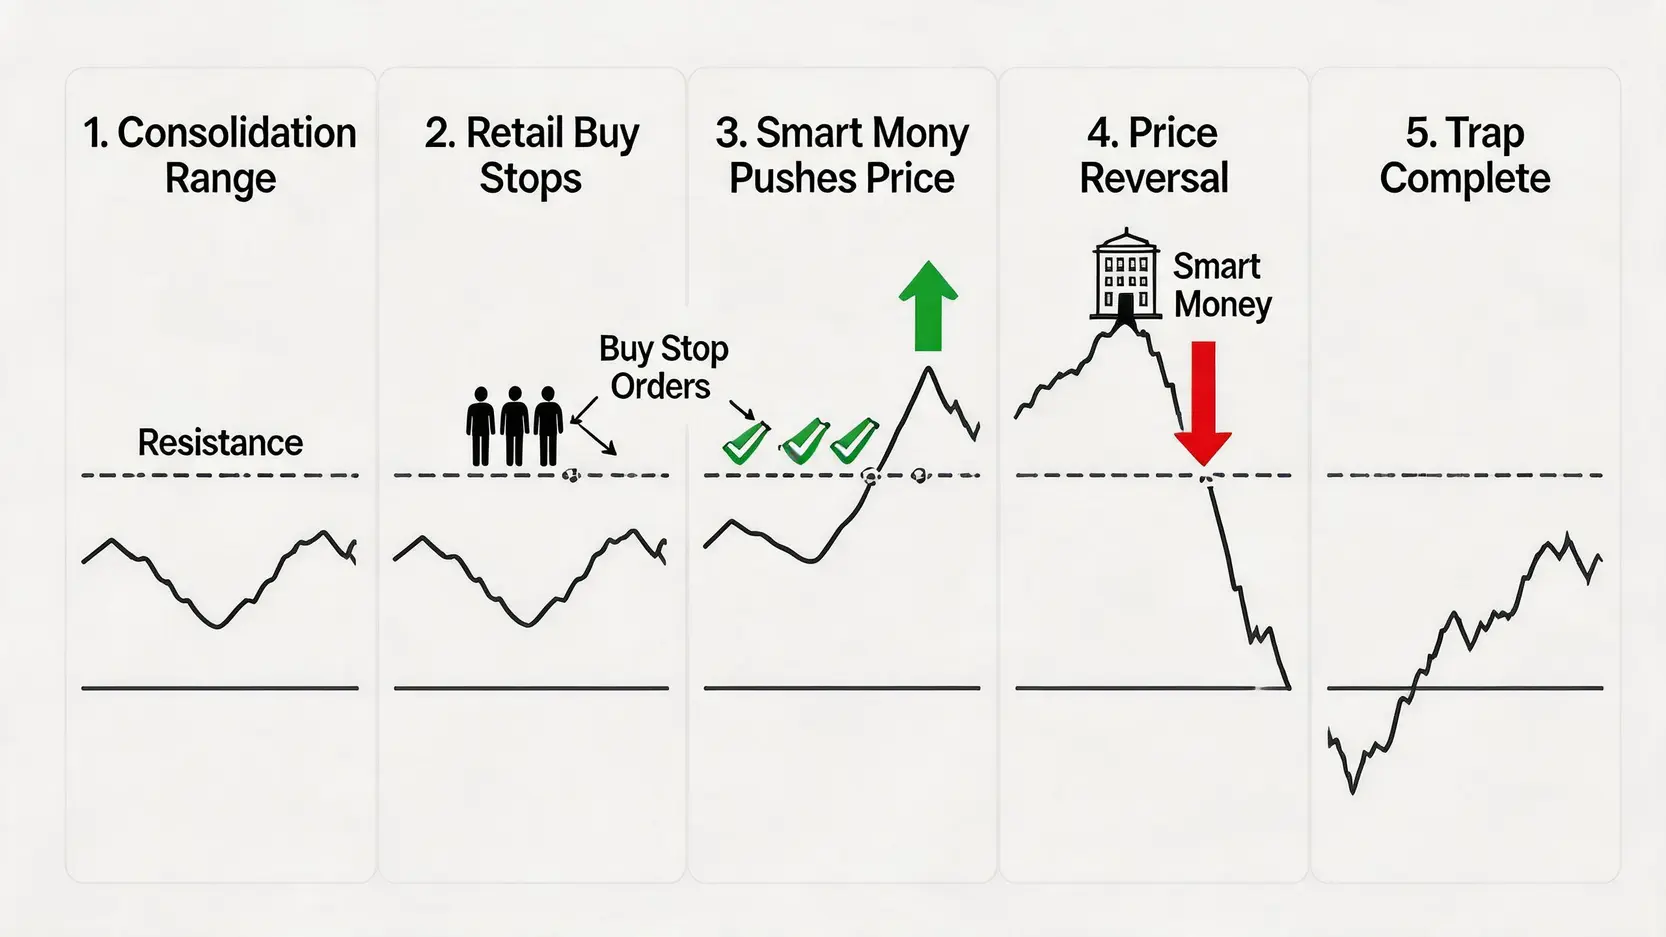
Diagram Explanation: How a Typical Stop-Loss Hunt Trap Forms

Let’s use a simple example to illustrate this process:

  1. Consolidation zone formation: Price moves within a range, forming a clear resistance level (previous high) and support level (previous low).
  2. Retail positioning: Many traders see this as resistance, so they place buy stop orders above the resistance (to chase long after a breakout), or they open short positions near resistance and place stop-loss orders above it.
  3. Institutional liquidity hunt: Price suddenly surges upward, breaking above the previous high resistance and triggering a large number of buy stop orders, creating a strongly bullish sentiment in the market.
  4. Price reversal: Just when retail traders believe a bull market is starting, price quickly reverses downward. This happens because institutions use retail buy orders above resistance to build their short positions.
  5. Distribution and profit: Price falls back below the original support level. Retail traders who chase longs are forced to exit via stop-loss, while institutional short positions begin to profit.

This entire process is a classic liquidity hunt targeting “buy-side liquidity”.流動性獵取陷阱的五個步驟圖解,從盤整、佈局、獵取到價格反轉的完整過程。

Typical buy-side liquidity hunting (bull trap) process


SMC Trading Strategy Core: How to Identify High-Liquidity Zones

After understanding the meaning of stop-loss hunting, the next step is learning how to mark “danger zones” on the chart, also known as high-liquidity areas. The SMC (Smart Money Concept) trading framework provides an effective set of tools for this.


Key Swing Highs and Swing Lows

Swing highs and swing lows are the most basic structural elements in technical analysis and also the areas where stop-loss orders cluster most frequently. Market participants tend to place stops above recent highs or below recent lows. Therefore, any clear, untested “previous high” or “previous low” becomes a potential liquidity pool.


Support and Resistance Zones Favored by Retail Traders

Horizontal support and resistance, trendlines, and channels are commonly used by retail traders for entries and stop placement. Because these levels are widely recognized, they often become targets for institutional liquidity hunts. When price approaches these “obvious” zones, extra caution is required.


Finding Smart Money Footprints Through Order Blocks and Fair Value Gaps

This is a more advanced SMC concept that helps identify where institutions may be positioning:

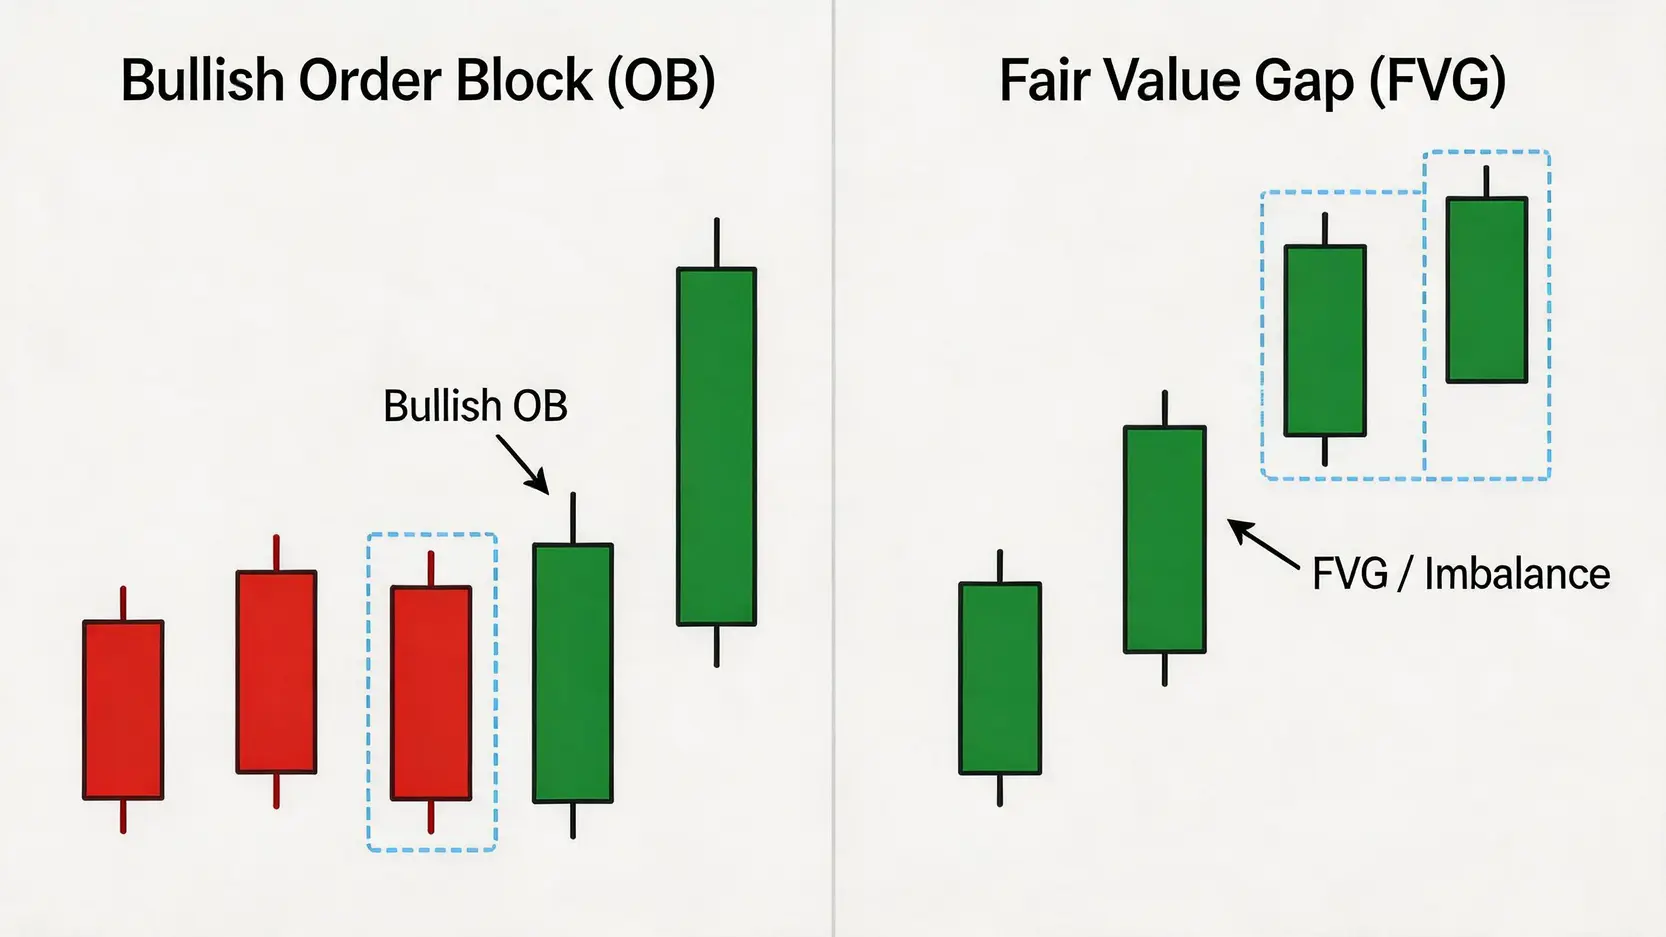
  • Order Block (OB): The last opposite-direction candle before a strong impulsive move. For example, the final bearish candle before a strong rally represents a bullish order block. This suggests institutional accumulation, and price may find support when revisiting this zone.
  • Fair Value Gap (FVG) or Imbalance: A price inefficiency created by a rapid move where one side of the market is dominant, leaving a gap in traded price levels. This represents an “inefficient” market area. Price has a high probability of returning to “fill” this gap as smart money uses it to optimize entry positions.

SMC 概念圖解,展示了 K 線圖上的看漲訂單塊(Order Block)和公允價值缺口(FVG)的形態。

SMC core concept: Order Blocks (OB) and Fair Value Gaps (FVG)

Learning to identify OB and FVG allows traders to more accurately anticipate where institutions may initiate moves or revisit price zones. For those interested in the smart money concept, it is recommended to study authoritative trading literature to gain a deeper understanding of its underlying logic.


Reverse to Offense: 3 Practical Liquidity Hunting Trading Strategies

After understanding institutional tactics, we should not only defend ourselves but also learn how to use liquidity hunting to identify high-probability trading opportunities. Below are three practical counter-hunting strategies.


Strategy 1: Market Structure Shift After Liquidity Grab (CHoCH)

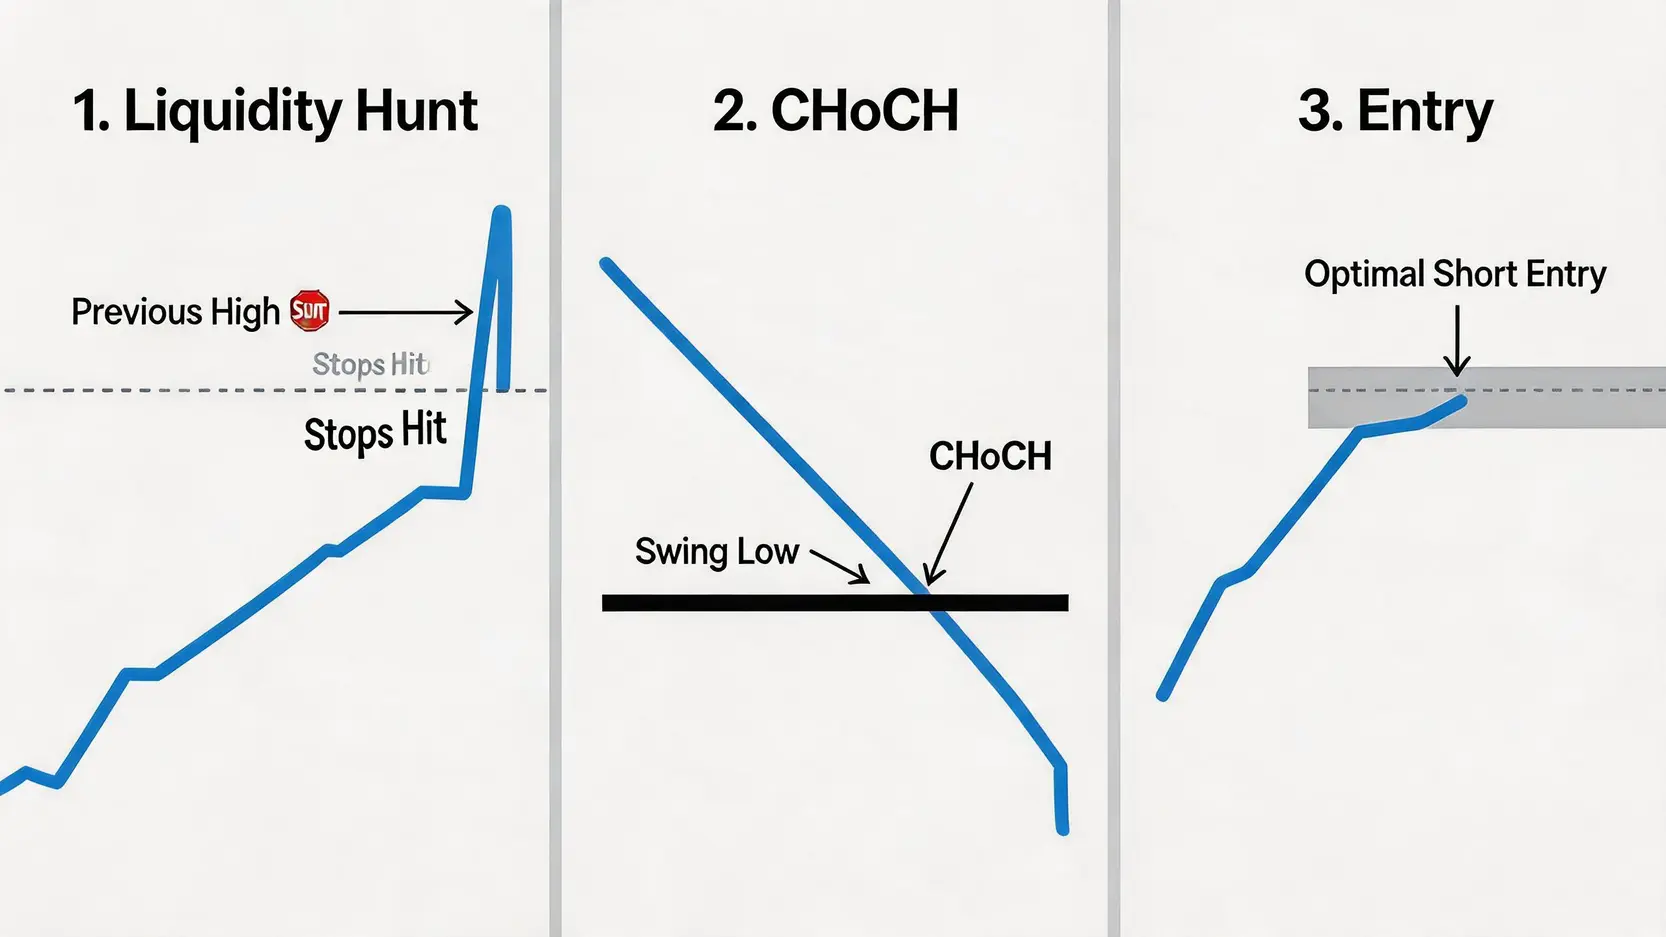
This is a relatively conservative “confirmation-based” entry strategy. After the price has swept liquidity at a high (or low), we do not enter immediately. Instead, we wait patiently for a clear market structure reversal signal.

  1. Observe the sweep: Price breaks above a previous high, taking buy-side liquidity.
  2. Wait for structure break: Price quickly reverses and breaks the “minor low” that caused the breakout. In SMC, this is called a “Change of Character (CHoCH)”.
  3. Find entry: The appearance of CHoCH strongly suggests buyer exhaustion and seller control. At this point, we look for a price to retest the liquidity grab area, such as an order block or FVG, to enter a short position.

市場結構轉變(CHoCH)交易策略的三個步驟,包括觀察獵取、等待結構破壞和尋找進場點。

Strategy Using CHoCH Signals to Turn Defense Into Offense

The core of this strategy is “waiting for confirmation”, avoiding impulsive entries immediately after a liquidity grab and being misled by false signals.


Strategy 2: Using Liquidity Grabs as Precise Entry Points to Ride Institutional Momentum

This is a more aggressive, “anticipation-based” entry strategy with higher risk but also higher potential returns. It requires a deeper understanding of market structure.

  • Pre-identify liquidity zones: First, mark obvious swing highs (or lows) where institutions are likely to hunt liquidity.
  • Place limit orders in advance: Place pending orders at specific levels above the liquidity zone (for short positions) or below it (for long positions) (for example at a higher-timeframe order block).
  • Precise stop-loss placement: Set stop-losses at reasonable levels where institutions are unlikely to reach during their sweep.

This strategy is like setting an ambush at expected institutional execution zones. Once price taps the area, traders can potentially catch the first wave of reversal. However, if the liquidity zone is misidentified, the trade can be stopped out immediately.


Strategy 3: How to Set Smarter Stop-Losses to Reduce Risk

Regardless of the strategy used, stop-loss is crucial. Since we know that institutions target obvious stop-loss zones, we should place our stop-loss in more “intelligent” locations.

  • Avoid obvious levels: Never place stops exactly above previous highs or below previous lows. Add some buffer distance instead.
  • Use volatility indicators: Apply ATR (Average True Range) to determine stop distance, for example placing stops at 1.5 times ATR below entry to allow more room for volatility.
  • Use market structure logic: Place stops beyond stronger structural points, such as below a confirmed bullish order block rather than a random swing low.


How to Avoid Being Hunted by Institutions? 4 Retail Trader Survival Guidelines

In addition to offensive strategies, building strong defensive habits is equally important. These four guidelines can significantly reduce the probability of becoming liquidity prey.


Guideline 1: Avoid Placing Stop-Losses at Obvious Levels

Always ask: “Is this level too obvious? Would most traders place their stops here?” If the answer is yes, relocate your stop. A slightly wider stop is often the price of avoiding a forced liquidation.


Guideline 2: Learn to Identify and Avoid False Breakout Traps

The process of institutions hunting liquidity often appears on the chart as a “false breakout”. A genuine breakout is usually accompanied by a significant increase in volume, and the price is able to hold above the breakout level. In contrast, a false breakout may show weak volume, and the price quickly returns to the previous range. Learning to distinguish between the two can help you avoid chasing longs at the top or shorting at the bottom.

Guideline 3: Trade in Alignment With Higher Timeframe Trends

Trading with the trend may sound cliché, but it is especially important here. If you go long based on a bullish signal on a 15-minute chart while the daily trend is clearly in a downtrend, you are likely trading against institutional direction. When your lower timeframe trades align with the higher timeframe trend, even if there are short-term shakeouts, price is more likely to move in your anticipated direction.


Guideline 4: Maintain Discipline and Avoid FOMO-Driven Trading

FOMO (Fear of Missing Out) is one of the biggest psychological traps for retail traders. Institutions often exploit this by creating fast moves that appear to be breakout opportunities. When price moves aggressively, stay calm and re-evaluate market structure instead of entering impulsively. Missing a trade is always better than taking an unnecessary loss.


Frequently Asked Questions (FAQ)

Q: Does liquidity hunting only happen in the cryptocurrency market?

A: No. Liquidity hunting is a phenomenon across all financial markets, including forex, stocks, futures, and indices. As long as a market has a large number of retail participants and institutional capital operating within it, this type of liquidity-driven market behavior will naturally exist.

Q: What is the main difference between SMC and traditional technical analysis?

A: Traditional technical analysis (such as trendlines, RSI, and MACD) is mainly based on historical price patterns and mathematical calculations, treating all market participants as a single entity. SMC, on the other hand, interprets the market from a “smart money vs retail” perspective. It focuses more on liquidity flow and order behavior, aiming to understand the “reason” behind price movement rather than only the “symptoms”.

Q: Will price always reverse after a stop-loss hunt?

A: Not necessarily. While liquidity grabs often trigger reversal moves, there are also “continuation hunts”. For example, in a strong uptrend, institutions may first push price below a support level to take sell-side liquidity (stop-losses from longs), accumulate more long positions, and then continue pushing price upward. Therefore, direction must always be confirmed with higher timeframe structure and trend context.

Q: Does learning SMC take a long time?

A: Yes. The SMC framework is relatively complex and requires time to fully understand, especially core concepts such as order blocks, fair value gaps, and market structure shifts. It often takes months or even longer of consistent study and backtesting to apply it effectively in real markets. It is not a shortcut system, but a deeper market framework.


Conclusion

In summary, understanding liquidity hunting strategies is a necessary step in every trader’s development journey. Through this SMC liquidity education, you have not only learned the true meaning of stop-loss hunting, but also how to identify institutional positioning and avoid becoming the target of liquidity grabs. Remember, the market is the domain of smart money, and traditional support and resistance thinking can easily lead to traps. Only by adopting their mindset and interpreting the market through the lens of liquidity can you improve your trading edge. Apply these concepts in your market observation and begin your evolution as a trader!

If you liked this article, please share it!

Related Articles

  • How to Buy Bitcoin in 2026: A Beginner’s Guide
    How to Get Started with Bitcoin? The Complete 2026 Bitcoin Buying Guide for Beginners After watching Bitcoin repeatedly reach new highs in recent years and successfully pass spot ETF reviews in the US and Hong Kong in 2024, officially entering mainstream financial markets, many investors have turned their attention to...
    2026 年 7 月 20 日
  • Gold V-Shaped Rebound: Bottom Signal or Bull Trap?
    Is Gold’s V-Shaped Rebound a Bottom-Fishing Signal? A Complete Guide to Trading Strategies Amid “$100 Price Swings” What Is a Gold V-Shaped Rebound? More Than Just a Technical Pattern The gold market has recently experienced sharp rises and falls, with prices frequently displaying dramatic “gold V-shaped rebounds”. Single-day “$100 price...
    2026 年 7 月 20 日
  • 2026 PPI Guide: PPI vs CPI and Stock Market Impact
    What Is PPI Data? 2026 Latest Analysis: Understand the Differences from CPI and How It Affects Stock Market Trends With market information constantly changing, do you always hold your breath while waiting for CPI data to be released? But did you know that a more forward-looking inflation indicator, PPI data...
    2026 年 7 月 20 日
返回顶部