Bollinger Bands Guide 2026: Settings & Squeeze Strategy

Updated: 2026/02/27  |  CashbackIsland

布林通道教學全攻略:5步驟搞懂指標設定、寬度收縮與超買超賣

The Complete Guide to Bollinger Bands: Understand Indicator Settings, Bandwidth Contraction, and Overbought and Oversold Conditions in 5 Steps

Do you often miss the start of a market rally, or fail to exit in time when a trend reverses? Many investors struggle with timing their buy and sell decisions. As a powerful technical analysis tool, Bollinger Bands effectively measure price volatility and trend direction. This comprehensive Bollinger Bands tutorial will guide you from the ground up, step by step, to master the core parameters of Bollinger Bands settings, learn how to interpret the key “Bollinger Band width contraction” signals, and accurately identify overbought and oversold zones, helping you find a clear trading path in complex markets. 


What Are Bollinger Bands? Understanding Market Trends Through Three Lines

Bollinger Bands are a technical analysis indicator invented in the 1980s by American analyst John Bollinger. They consist of three bands that form a channel surrounding price movements. Each of these three lines plays a distinct role, collectively depicting market volatility and relative highs and lows, allowing traders to understand current market conditions more intuitively.


Middle Band: Average Market Cost and Trend Direction

The middle band is essentially a simple moving average (SMA), representing the average market cost over a specific time period. When price consistently trades above the middle band, it usually indicates a bullish (upward) trend. Conversely, when price consistently trades below the middle band, it may suggest a bearish (downward) trend. The middle band serves as the benchmark for identifying trend direction and the dividing line between bullish and bearish forces.


Upper Band and Lower Band: Dynamic Zones of Resistance and Support

The upper and lower bands are calculated by adding to and subtracting from the middle band a specified multiple of standard deviation. These two lines form a dynamic price channel that expands or contracts with changes in market volatility.

  • Upper band: Typically regarded as dynamic resistance. When price touches or approaches the upper band, it may indicate that the current price is relatively high and facing pullback pressure.
  • Lower band: Typically regarded as dynamic support. When price touches or approaches the lower band, it may indicate that the current price is relatively low and has rebound support.

The range formed by the upper and lower bands provides a concept of relative price highs and lows, helping traders identify potential entry and exit points.

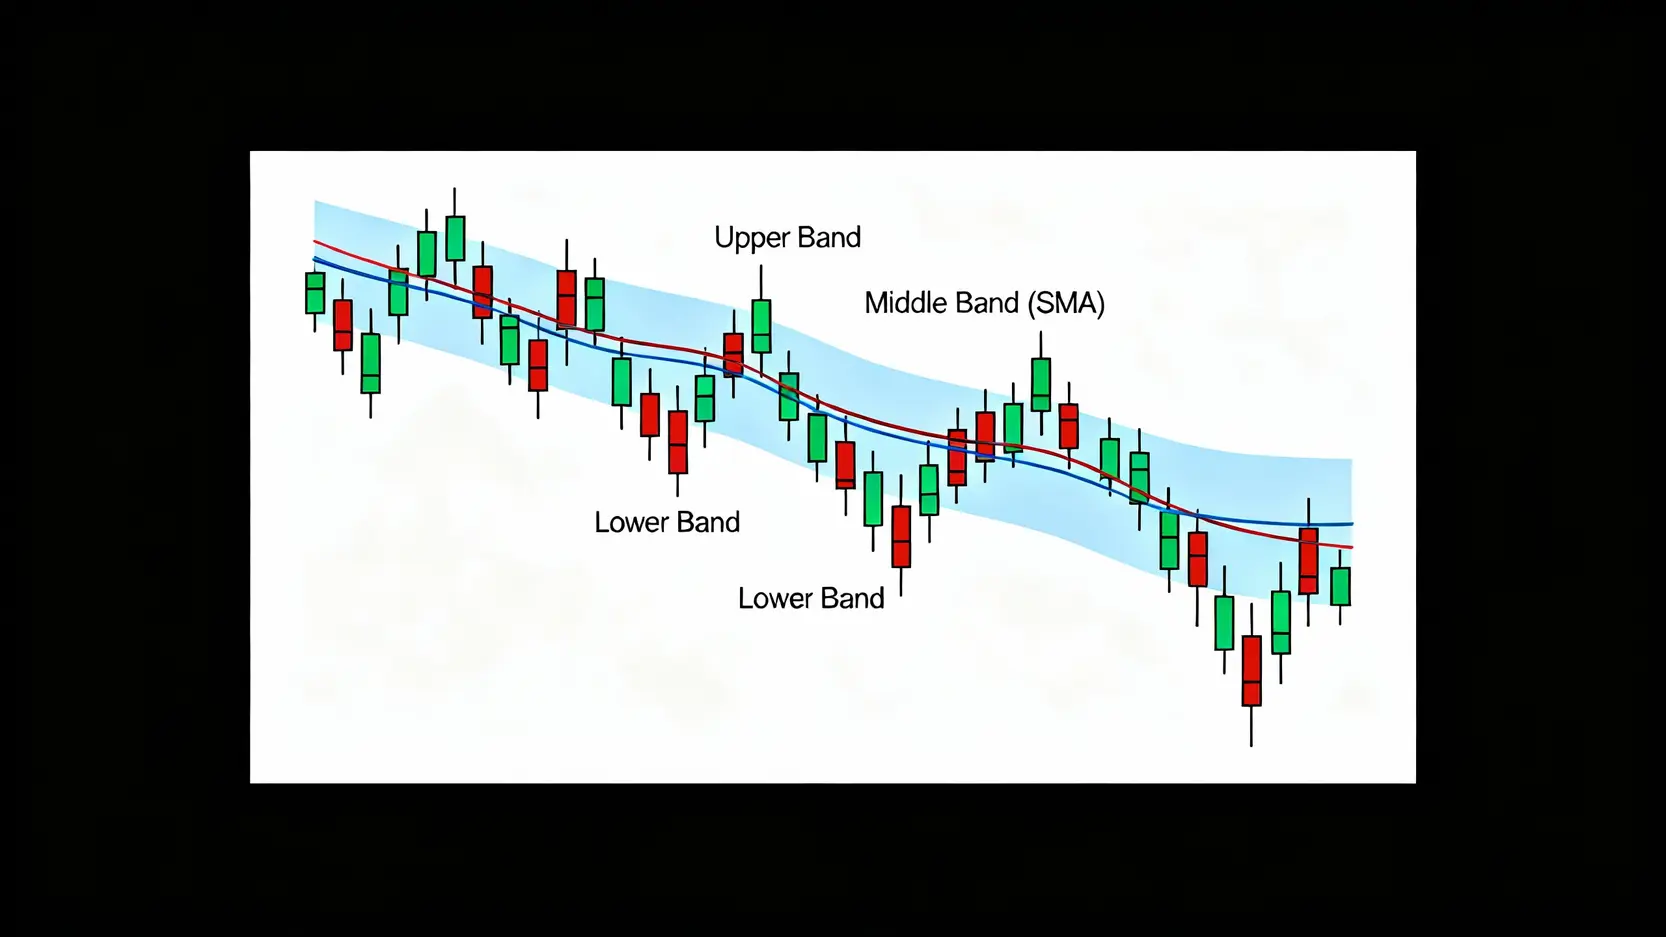
布林通道結構圖,顯示上軌、中軌(移動平均線)和下軌如何圍繞著K線價格波動。

Bollinger Bands consist of three lines: the upper band representing resistance, the middle band serving as the trend benchmark, and the lower band representing support.


Core Concept: Why “Standard Deviation” Is the Soul of Bollinger Bands?

Standard deviation is a statistical measure used to quantify the degree of dispersion in data. In Bollinger Bands, it measures the magnitude of price fluctuations relative to the middle band (which represents the average cost). This is the core essence of Bollinger Bands:

  • When volatility is high: Price movements are more aggressive, standard deviation increases, and the distance between the upper and lower bands expands accordingly.
  • When volatility is low: Price movements become more stable, standard deviation decreases, and the distance between the upper and lower bands contracts.

Through standard deviation, Bollinger Bands can automatically adjust to changes in market volatility, making them more flexible and informative than traditional fixed channel indicators, such as Donchian Channels. According to the explanation of Investopedia, approximately 95 percent of price movements occur within two standard deviations. 

How to Set Bollinger Bands? A Guide to the Golden Parameter Settings

To use Bollinger Bands effectively, correct indicator settings are crucial. Although the parameters can be customized, there is a set of widely accepted “golden parameters” in the market that serve as an excellent starting point for both beginners and experienced traders.


Step 1: Set the “Period”: Why Is 20MA the Market Consensus?

The middle band of Bollinger Bands is a moving average, and the setting of its “period” parameter directly affects the indicator’s sensitivity. The most commonly used market setting is 20 periods (for example, on a daily chart, it is the 20 day moving average).

There are several reasons for choosing 20MA:

  • Monthly trading days: A month has about 20 trading days. The 20MA can reflect the average market cost over the past month and is representative.
  • Good balance: A period shorter than 20 (such as 10MA) makes the indicator overly sensitive and generates too much noise. A period longer than 20 (such as 50MA), reacts more slowly and may miss early trend signals. The 20MA achieves a strong balance between responsiveness and stability.
  • Market consensus: Since most traders use 20MA as the Bollinger Bands parameter, it creates a “self fulfilling prophecy”, making support and resistance levels based on this parameter more effective.


Step 2: Set the “Standard Deviation”: The Statistical Meaning and Practical Use of 2 Standard Deviations

The multiple of standard deviation determines the width of the bands. The setting recommended by the inventor, John Bollinger, and also the most commonly used market setting, is 2 standard deviations.

The statistical basis behind this is the theory of the normal distribution. In a normally distributed dataset, about 95.4 percent of values fall within plus or minus 2 standard deviations of the mean. In other words, there is more than a 95 percent probability that price will remain between the upper and lower Bollinger Bands. Therefore, when price touches or even breaks through the upper or lower band, it indicates a relatively extreme market move, which is a signal traders should pay special attention to.

Overall, the golden parameter set of “period 20, standard deviation 2” is the most reliable starting point in practical trading. Unless you have a very clear trading strategy or have backtested a specific instrument, it is not recommended to modify it casually.


Interpret Key Signals: Use “Bollinger Band Width Contraction” to Anticipate the Next Major Move

Bollinger Bands not only help identify trends, but changes in their width also provide important clues for forecasting future price action. Learning to interpret Bollinger Band width contraction and expansion is a key step from beginner to advanced.

Band Contraction (Squeeze): Consolidation Builds Energy, Signaling an Imminent Breakout

When the upper and lower bands keep moving closer to the middle band, making the entire channel very narrow, this phenomenon is called “contraction” or a “squeeze”. It indicates that market volatility has fallen to extremely low levels, price is trapped in a sideways range, and bulls and bears have reached a temporary balance. However, this calm is often the quiet before the storm. Bollinger Band width contraction usually suggests:

  • Energy build up: The market is building energy for the next major move.
  • Direction unclear: You should not rush to enter, because the trend direction has not yet been confirmed.
  • Breakout imminent: The longer the squeeze lasts, the more intense the move may be after price breaks out.

Traders should closely monitor price action after a squeeze. Once price breaks above the upper band or falls below the lower band on increased volume, it usually signals the start of a new trend.


Band Expansion: A Confirmation Signal of Trend Initiation

After a period of contraction, if price suddenly experiences a sharp move that causes the upper and lower bands to spread apart rapidly, this is known as an “expansion”. Band expansion is a strong confirmation signal that a trend has begun, indicating a sharp increase in volatility and that a clear one directional move (either upward or downward), is likely already underway.

At this stage, traders can operate in the direction of the breakout. For example, if price breaks upward and drives band expansion, it can be regarded as a buy signal. Conversely, if price breaks downward, it can be viewed as a sell or short signal.

布林帶寬度收縮與擴張示意圖,展示了從低波動率的通道擠壓到價格突破後高波動率的通道擴張過程。

“Band contraction” signals energy accumulation, while the subsequent “band expansion” is a strong signal of trend initiation.


Core Trading Strategy: How to Identify Overbought and Oversold Zones?

Many people study Bollinger Bands with the intention of finding precise overbought and oversold zones for countertrend trading (buying the dip and selling the top). However, this is also where misunderstandings most commonly arise and losses are most likely to occur. Correctly interpreting overbought and oversold signals requires combining them with the prevailing trend direction. 

Debunking the Myth: Does Touching the Upper Band Mean an “Overbought” Signal?

A common misconception is that when price touches the upper band, it indicates an “overbought” condition and should be sold immediately. This view is extremely dangerous!

In a strong bullish trend, price will frequently move while “hugging” the upper band, a phenomenon known as “walking the bands”. If you attempt to short simply because price touches the upper band, you are effectively going against overwhelming momentum and may suffer significant losses. Therefore, price touching the upper band only indicates that “price is relatively strong”, not an absolute “overbought” sell signal.

布林通道帶狀行走示意圖,解釋在強勁上漲趨勢中,價格沿著上軌運行時不應逆勢放空。

In strong market conditions, prices will “walk along the Bollinger Bands”. In this case, touching the upper band reflects strong momentum rather than a sell signal.


Precise Application: If Price Breaks Below the Lower Band, Is It “Oversold” and Safe to Buy the Dip?

Similarly, when price touches or breaks below the lower band, it does not necessarily represent an absolute “oversold” condition or a safe dip buying opportunity. In a strong bearish trend, price can also continue to decline while hugging the lower band. Entering a dip buy rashly in such conditions often results in catching a falling knife.

Price touching the lower band merely indicates that “price is relatively weak”. Only during clear consolidation phases or pullbacks within an uptrend does touching the lower band potentially form a better short term buying opportunity.


Trading With the Trend and Against the Trend: Combine Band Direction to Form Your Trading Plan

So how should Bollinger Bands be used correctly in trading? The key lies in “trading with the trend”.

  1. Determine the trend direction: First observe the direction of the middle band (20MA). When the middle band slopes upward, it is considered a bullish trend. When it slopes downward, it is considered a bearish trend. When it moves horizontally, it is regarded as consolidation.
  2. Form a trend following strategy:
    • In a bullish trend: Focus your strategy on “buying”. When price pulls back from the upper band toward the middle band or finds support near the lower band, look for buying opportunities. Avoid countertrend short selling.
    • In a bearish trend: Focus your strategy on “selling” or “shorting”. When price rebounds from the lower band toward the middle band or encounters resistance near the upper band, look for selling opportunities. Avoid countertrend dip buying.
    • In a consolidation range: The bands are usually relatively flat and narrow. You may consider countertrend strategies of buying near the lower band and selling near the upper band. However, strict stop losses must be set to guard against sudden transitions into trending conditions.

Remember, Bollinger Bands are an auxiliary tool, not a trading holy grail. Only by combining them with trend analysis can their effectiveness be maximized and common trading pitfalls avoided.


Common Questions About Bollinger Bands (FAQ)

Q: Are Bollinger Bands applicable to all financial instruments (stocks, futures, forex)?

A: Yes. Bollinger Bands are a highly versatile technical indicator. Their underlying principle is based on the statistical behavior of price volatility, which makes them applicable to almost all liquid financial instruments, including stocks, indices, ETFs, forex, futures, and cryptocurrencies. In any market, as long as there is a price candlestick chart, Bollinger Bands can be applied for analysis.

Q: Which indicators should be combined with Bollinger Bands for the best results?

A: To improve the accuracy of trading signals, Bollinger Bands are often combined with other indicators to create a complementary effect. Common combinations include:
1. Combined with the Relative Strength Index (RSI) or the Stochastic Indicator (KD): Used to confirm overbought and oversold signals. For example, when price touches the lower Bollinger Band while RSI also enters the oversold zone (below 30), the probability of a successful buy increases.
2. Combined with volume (Volume): When price breaks out of a band contraction zone with expanding volume, the validity of the breakout is significantly strengthened.
3. Combined with moving averages (such as the 60MA): Use a longer period moving average to identify the primary trend, and then use Bollinger Bands to find trend following entry points.

Q: What is the most common mistake when using Bollinger Bands?

A: The most common and costly mistake is engaging in countertrend trading during strong trending markets. Many beginners assume that touching the upper band represents a price peak and initiate short positions, or that touching the lower band represents a bottom and initiate buy positions. The result is often being squeezed out or trapped by the strength of the trend. Always remember that when a clear trend is present (with the bands expanding and the middle band sloping), you should trade in the direction of the trend and look for pullback entries, rather than trying to predict tops or bottoms.

Q: What is the purpose of the Bandwidth indicator?

A: The Bandwidth indicator (%B or Bandwidth) is an auxiliary indicator designed to quantify the width of Bollinger Bands. Its formula is “(Upper Band – Lower Band) / Middle Band”. When this indicator reaches historically low levels, it indicates that the Bollinger Bands are in an extremely contracted state, signaling that a major move may be approaching. Traders can use this indicator to systematically identify trading opportunities related to “band contraction”.


Conclusion

In summary, Bollinger Bands are an extremely practical and versatile indicator. They not only display trend direction but also reveal the state of market volatility. Learning the correct Bollinger Bands settings (period 20, standard deviation 2) and developing a deep understanding of the market implications behind Bollinger Band width contraction will help you identify potential trading opportunities earlier. Keep in mind that simply touching the upper or lower bands does not constitute an absolute overbought or oversold signal. Always combine this analysis with the overall trend direction to avoid countertrend trading in strong markets. Open your charting platform now and start applying the techniques from this Bollinger Bands tutorial to optimize your trading decisions!

If you liked this article, please share it!

Related Articles

  • How to Buy Bitcoin in 2026: A Beginner’s Guide
    How to Get Started with Bitcoin? The Complete 2026 Bitcoin Buying Guide for Beginners After watching Bitcoin repeatedly reach new highs in recent years and successfully pass spot ETF reviews in the US and Hong Kong in 2024, officially entering mainstream financial markets, many investors have turned their attention to...
    2026 年 7 月 20 日
  • Gold V-Shaped Rebound: Bottom Signal or Bull Trap?
    Is Gold’s V-Shaped Rebound a Bottom-Fishing Signal? A Complete Guide to Trading Strategies Amid “$100 Price Swings” What Is a Gold V-Shaped Rebound? More Than Just a Technical Pattern The gold market has recently experienced sharp rises and falls, with prices frequently displaying dramatic “gold V-shaped rebounds”. Single-day “$100 price...
    2026 年 7 月 20 日
  • 2026 PPI Guide: PPI vs CPI and Stock Market Impact
    What Is PPI Data? 2026 Latest Analysis: Understand the Differences from CPI and How It Affects Stock Market Trends With market information constantly changing, do you always hold your breath while waiting for CPI data to be released? But did you know that a more forward-looking inflation indicator, PPI data...
    2026 年 7 月 20 日
返回顶部