JPY Cross Pairs: AUD/JPY Volatility & Strategy Guide

Japanese Yen Cross Pairs Volatility Analysis: The Ultimate Guide to AUD/JPY Trading Strategy and Risk Management
Japanese Yen cross pairs, especially currency pairs like AUD/JPY, are well known in the forex market for their extreme volatility. This characteristic offers significant profit potential, but it also comes with extremely high risk that deters many traders. Are you also looking to capture these opportunities but feel confused about how to conduct in-depth Japanese Yen cross pair volatility analysis, or unsure how to develop an effective AUD/JPY trading strategy? This article provides you with a complete trading framework, covering the core concept of JPY cross pairs, the causes of volatility, practical trading strategies, and most importantly, key risk management techniques for JPY cross pairs, helping you navigate the highly volatile market more steadily.
What Are Japanese Yen Cross Pairs? Breaking Down Their Unique Volatility
Before diving into AUD/JPY trading strategies, it is essential to understand the nature of Japanese Yen cross pairs. Simply put, any currency pair that does not involve the US dollar but includes the Japanese Yen is referred to as a “Japanese Yen cross pair”, such as AUD/JPY, EUR/JPY, or GBP/JPY. Their pricing is derived through each currency’s exchange rate against the US dollar, which also explains why their volatility is significantly higher.
JPY Cross Pairs vs. US Dollar Major Pairs: A Comparison of Trading Advantages and Disadvantages
Whether to trade cross pairs or US dollar major pairs (such as USD/JPY) depends on your trading style and risk tolerance. Below is a clear comparison:
| Characteristics |
Japanese Yen Cross Pairs (e.g., AUD/JPY) |
US Dollar Major Pairs (e.g., USD/JPY) |
| Volatility |
High, with both higher potential profits and risks |
Relatively lower, with more stable price movements |
| Trading Opportunities | When trends are clear, it provides more short-term trading opportunities | High liquidity, suitable for conservative traders |
| Spread | Usually wider, with slightly higher trading costs | Very tight, with low trading costs |
| Analytical Complexity | Requires analysis of both currencies as well as global risk sentiment | Mainly focuses on US and Japanese economic data |
Factors Influencing AUD/JPY Volatility: The 3 Core Drivers
Understanding the factors driving extreme volatility in JPY cross pairs is the foundation for building an effective trading strategy. The following three factors are crucial:
- Interest Rate Differentials: This is the core of “carry trade”. When a country’s interest rate, such as Australia’s, is significantly higher than Japan’s ultra-low interest rate, investors borrow Japanese Yen at low cost and buy higher-yielding Australian dollars to earn the interest rate differential. This pushes up the AUD/JPY exchange rate. Conversely, when the interest rate gap narrows, it may trigger selling pressure.
- Market Risk Sentiment: The Japanese Yen is widely regarded as a global “safe-haven currency”. When global economic prospects are optimistic and investors are willing to take risks (Risk-on), capital flows out of the Yen and into higher-risk currencies like the Australian dollar, driving AUD/JPY higher. When the market turns fearful (Risk-off), such as during geopolitical tensions or financial crises, investors seek safety by buying the Yen, causing AUD/JPY to drop sharply. Therefore, monitoring market risk sentiment is key when trading this currency pair.
- Central Bank Policies: The monetary policy decisions of the Bank of Japan (BOJ) and the Reserve Bank of Australia (RBA) are major drivers. Any signals regarding interest rate changes, monetary easing, or tightening can directly impact exchange rates. For example, if the Bank of Japan signals an end to its ultra-loose monetary policy, it may lead to a significant appreciation of the Yen.

Three Core Factors Influencing Japanese Yen Cross Pair Volatility
Further Reading (Highly Recommended)
AUD/JPY Trading Strategy Full Guide
After understanding the basic concepts, we can now dive into specific AUD/JPY trading strategies. Due to its unique characteristics, this currency pair is a favorite among many professional traders.
Why AUD/JPY Is a Key Indicator of Market Risk Sentiment?
AUD/JPY is often referred to as a “barometer of risk sentiment” or the “canary in the coal mine”. This is because it perfectly combines two currencies with opposite characteristics:
- Australian Dollar (AUD): A “risk currency” or “commodity currency”. Australia is a major global exporter of commodities such as iron ore and coal, and its economy is closely tied to global economic growth. When the global economy improves and demand for commodities increases, the Australian dollar typically strengthens.
- Japanese Yen (JPY): A “safe-haven currency”. Japan is the world’s largest creditor nation, with a stable political environment and vast overseas assets. During global market turbulence, capital flows back into Japan for safety, strengthening the Yen.
Therefore, when AUD/JPY rises, it usually indicates optimistic market sentiment (Risk-on). When it falls, it signals rising risk aversion (Risk-off).

AUD/JPY: A Barometer of Market Risk Sentiment
3 Practical AUD/JPY Trading Strategies
Given the high volatility of AUD/JPY, the following three strategies are widely used:
- Carry Trade: This is a longer-term strategy. When Australian interest rates are significantly higher than Japan’s, traders buy and hold AUD/JPY to earn both capital gains and daily swap interest. However, it is important to note that when market sentiment suddenly reverses, exchange rate losses may far exceed interest income, so strict risk management is essential.

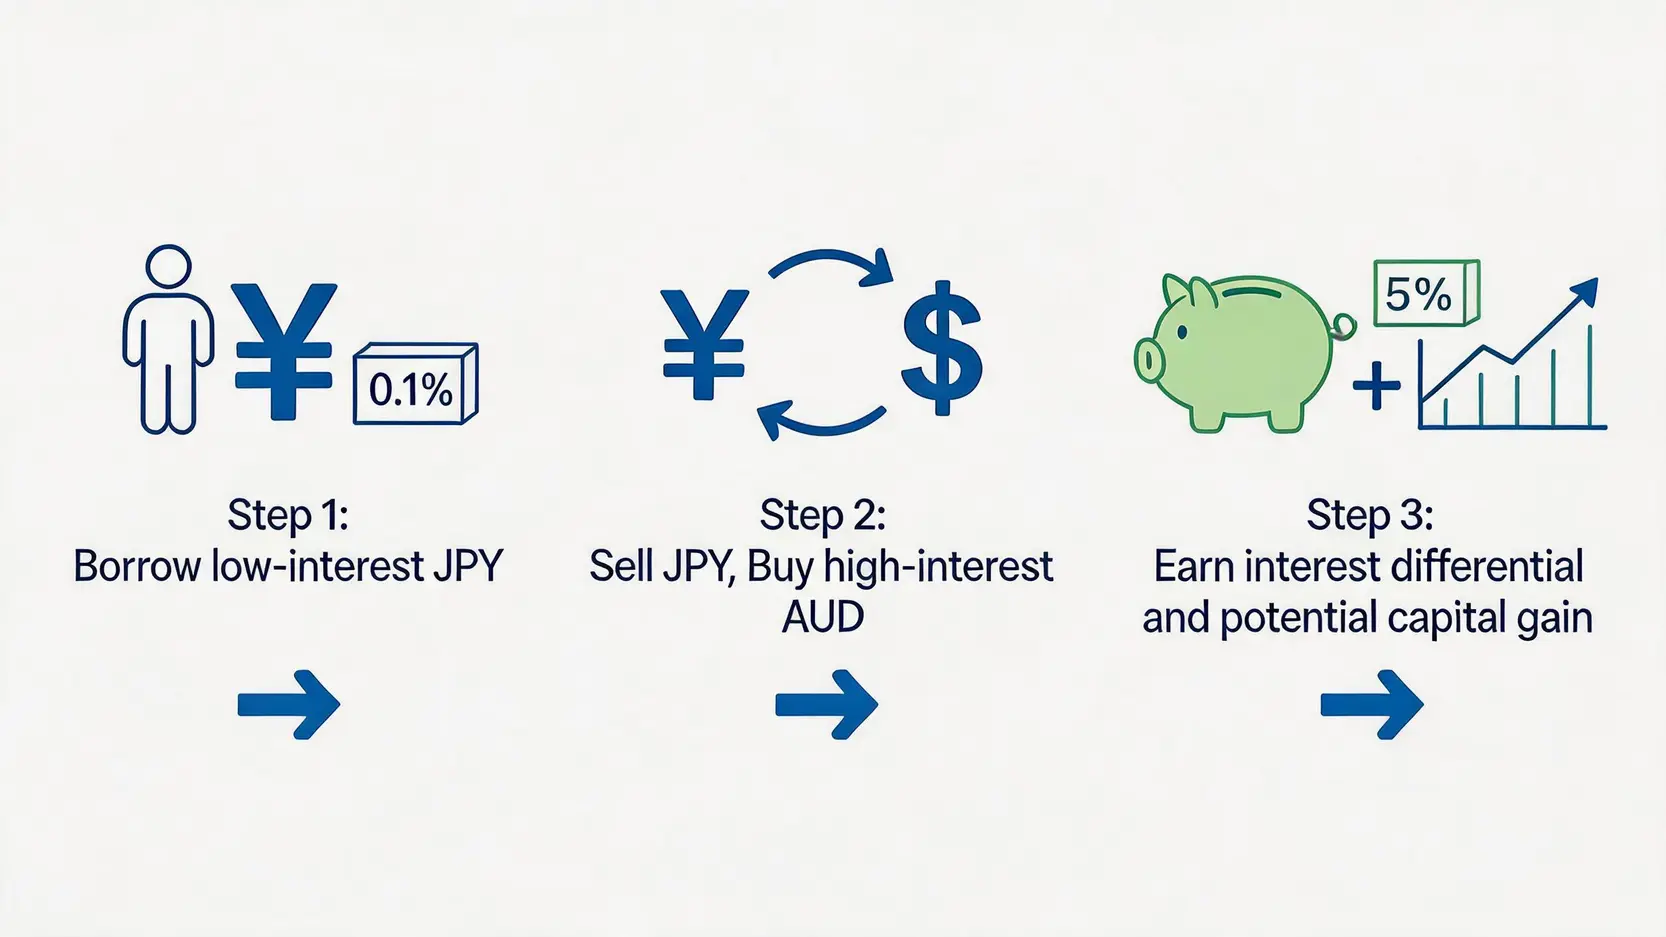
Carry Trade Operational Process Diagram
- Trend Following: AUD/JPY often forms clear and sustained trends. Traders can use moving averages (such as the 50-day and 200-day moving averages) to identify the main trend direction. When the price is above the 200-day moving average and the 50-day crosses above the 200-day (golden cross), it is considered a bullish signal and a buying opportunity. Conversely, a death cross signals potential selling opportunities.
- Range Trading: When the market lacks a clear direction, AUD/JPY may move within a defined range. Traders can use oscillators such as the Relative Strength Index (RSI) or Stochastic indicators. Buy when the price reaches the lower boundary and indicators show oversold conditions; sell when the price reaches the upper boundary and indicators show overbought conditions.
Technical Analysis: How to Identify Key AUD/JPY Support and Resistance Levels
Regardless of the strategy used, precise forex technical analysis is the foundation of success. For AUD/JPY, the following points are especially important:
- Psychological Round Numbers: Levels such as 90.00, 95.00, and 100.00 often act as key support or resistance zones.
- Previous Highs and Lows: Historical swing highs and lows are widely watched reference points among market participants and serve as strong support or resistance.
- Fibonacci Retracement: After a strong uptrend or downtrend, prices often retrace to the 38.2%, 50%, or 61.8% levels, which are excellent potential entry zones.
JPY Cross Pair Risk Management: A Practical Guide to Avoiding Common Pitfalls
Trading highly volatile Japanese Yen cross pairs without strict discipline and a well-structured JPY cross pair risk management plan is no different from gambling. The profit potential is attractive, but losses can also come quickly and severely.
Setting Proper Stop Loss and Take Profit Levels
This is one of the most fundamental and important elements in forex margin trading. Before opening any position, you must clearly define:
- Stop Loss: When the market moves against your expectation, what is the maximum loss you are willing to accept? Stop loss can be placed beyond key support or resistance levels, or calculated using the Average True Range (ATR) indicator to determine a reasonable distance, preventing you from being easily “stopped out” by normal market fluctuations.
- Take Profit: Where is your potential profit target? A healthy Risk/Reward Ratio should be at least 1:1.5, with an ideal level of 1:2 or higher. This means risking 1 unit to potentially gain 2 units or more.
Position Sizing: How Much Should You Risk Per Trade?
A common reason many beginners fail is not flawed strategy, but excessive position sizing. Professional traders strictly control risk per trade. A widely accepted rule is the “2% rule”, meaning the maximum loss on any single trade should not exceed 2% of total account capital.
Formula:
Position Size (Lots) = (Total Capital × Risk Percentage) / (Stop Loss in Pips × Value per Pip)
For example, if your account has 5,000 US dollars and you are willing to risk 1% (50 US dollars), with a stop loss of 50 pips, and assuming a standard contract where each pip is worth 10 US dollars, your position size would be far less than 1 standard lot. Precise calculation ensures that even after several consecutive losses, you still have sufficient capital to stay in the market.
Further Reading (Highly Recommended)
Conclusion
In summary, successful Japanese Yen cross pair trading begins with a deep understanding of its high volatility, combined with a clear AUD/JPY trading strategy. You may be a long-term investor utilizing interest rate differentials, or a short-term trader capturing shifts in market sentiment. However, the foundation of all success lies in the most critical step: executing strict JPY cross pair risk management. Setting stop losses, calculating position size, and maintaining discipline may seem unexciting, but they are the key factors that determine whether you can survive in the market long term. It is hoped that the analysis and techniques provided in this article will help you accumulate wealth steadily while navigating high-volatility markets.
Frequently Asked Questions (FAQ)
Q: What is the best time to trade Japanese Yen cross pairs?
A: Japanese Yen cross pairs perform differently across trading sessions. The most volatile periods are typically the overlap between the Asian session (Tokyo open) and the European session (London open), as well as the overlap between the European and North American sessions (New York open). These periods have the highest number of market participants, resulting in the highest liquidity and volatility, which creates more trading opportunities.
Q: Do Japanese Yen cross pairs have wider spreads than major pairs?
A: Yes, they usually do. Since cross pairs have lower liquidity compared to US dollar major pairs (such as USD/JPY or EUR/USD), and their pricing is derived from combining two major exchange rates, brokers typically offer wider bid-ask spreads. This is an additional cost to consider when trading cross pairs.
Q: Besides AUD/JPY, which other JPY cross pairs are worth watching?
A: Other popular Japanese Yen cross pairs include:
- EUR/JPY (Euro/Japanese Yen): Also highly volatile, influenced by economic data and central bank policies in both the Eurozone and Japan.
- GBP/JPY (British Pound/Japanese Yen): Known as the “Dragon” or “Widow Maker”, it is one of the most volatile major currency pairs, carrying extremely high risk but also high potential returns.
- CAD/JPY (Canadian Dollar/Japanese Yen): The Canadian dollar is a commodity currency closely correlated with oil prices, so this pair reflects both risk sentiment and energy market movements.
Q: How much do Japanese economic data affect JPY cross pairs?
A: The impact is significant. Although cross pairs do not directly include the US dollar, any factor that affects the value of the Japanese Yen will impact all JPY cross pairs. For example, Japan’s core CPI, GDP growth rate, Tankan survey, and any verbal intervention from the Japanese government or the Bank of Japan can trigger sharp volatility across all JPY cross pairs. Therefore, traders must closely monitor Japan’s macroeconomic conditions when trading these instruments.
Related Articles
-
In-Depth Review of Intelligent Order Flow Detection Tools: Understanding Institutional Activity and Identifying Real Market Buying and Selling Pressure What Is Order Flow, and Why Is It a “Leading Indicator” for Price Prediction? Candlestick charts and technical indicators can be misleading, but the real-money "Order Flow" within the market cannot....2026 年 6 月 4 日
-
Social Sentiment Quantitative Indicators: Mining PTT and Dcard Discussions to Predict Stock Prices What Are Social Sentiment Quantitative Indicators, and Why Are They Becoming Increasingly Important? In an era of information overload, financial markets are no longer driven solely by cold financial statements and macroeconomic data. The "Shipping King" phenomenon...2026 年 6 月 4 日
-
Avoid Fraudulent Platforms! A Visual Guide to Taiwan FSC Licensed Futures Merchant Verification and Scam Prevention In recent years, driven by heightened volatility in global financial markets and the impact of monetary easing policies worldwide, more investors have begun seeking diversified investment instruments. However, underground futures operators and overseas fraudulent...2026 年 6 月 4 日


