ADX values are the key to assessing trend quality: above 25 indicates a confirmed trend, while below 20 indicates a ranging market.
In general, there is broad consensus on how ADX values are interpreted:
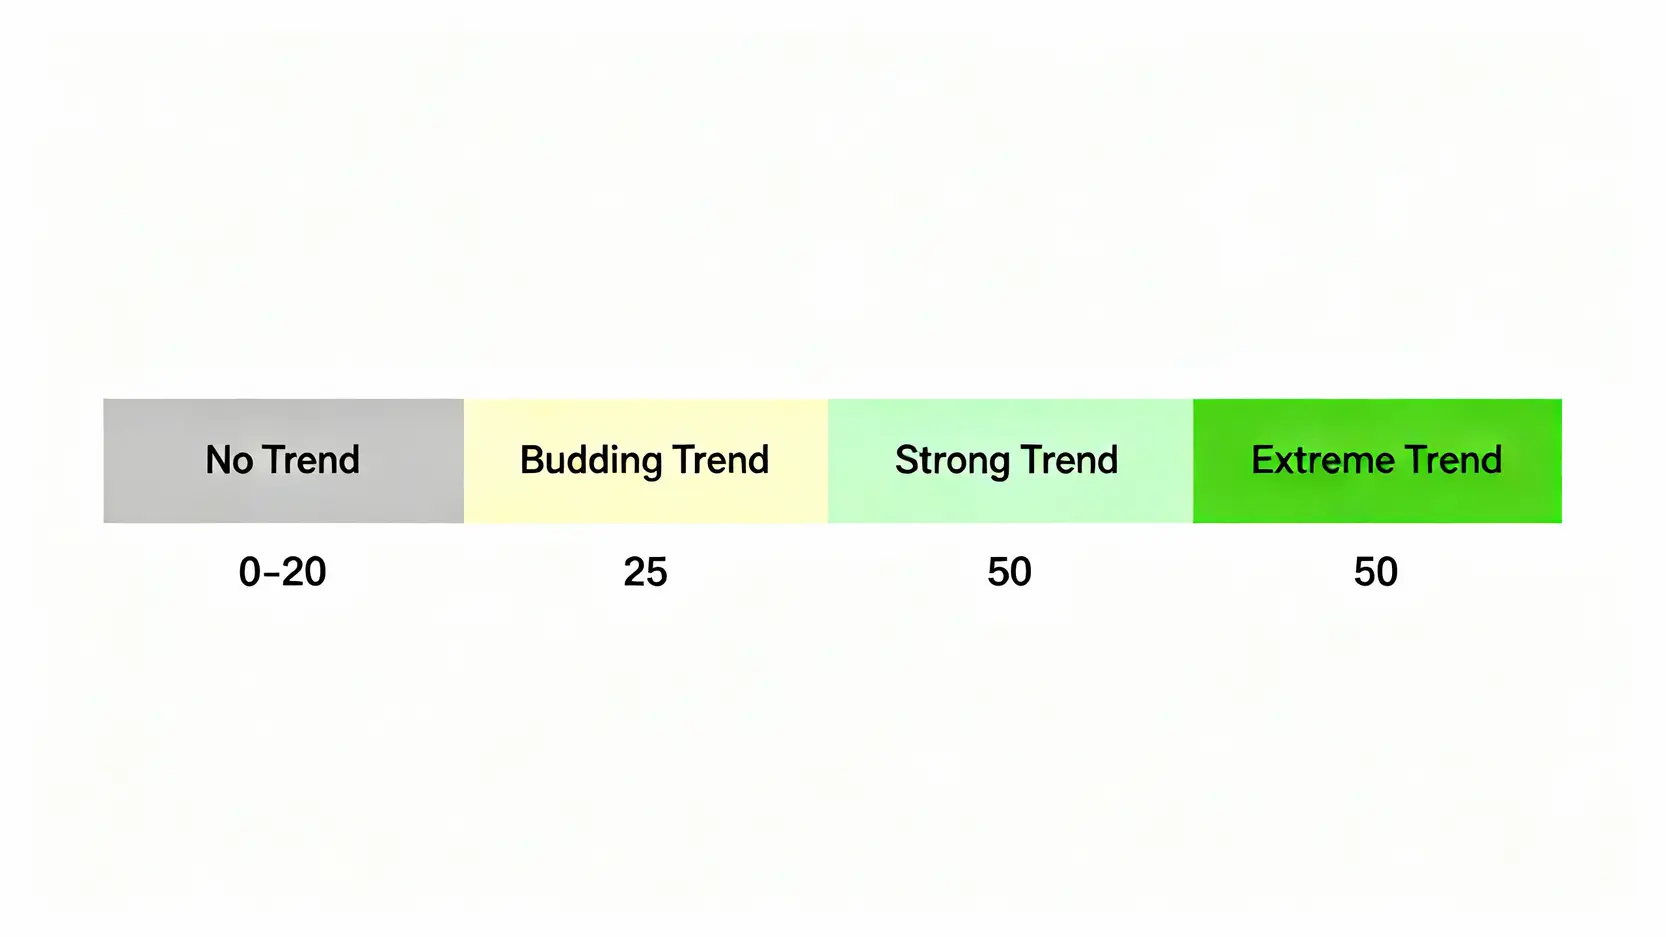
- ADX < 20: No trend or an extremely weak trend. The market is moving sideways, direction is unclear, and price fluctuations lack directional bias. Observation is recommended, and trend-following strategies should be avoided.
- ADX 20-25: Trend formation phase. The market may be transitioning from consolidation into a trend, or a trend may be gradually forming, requiring close monitoring.
- ADX > 25: Trend confirmed. The market has a clear and noteworthy trend (whether upward or downward). The higher the ADX value, the stronger the trend.
- ADX > 50: Extremely strong trend. The market is in a major advancing or declining phase, with very strong trend momentum. However, when ADX values become excessively high (such as above 75), it may also signal trend exhaustion and potential reversal risk.
Technique 3: ADX Turning Points: The Secret Signals of Trend Initiation or Conclusion
Beyond the values themselves, “turning points” in the ADX line also contain important trading information.
- ADX Turning Up From Low Levels: When ADX has hovered below 20 for an extended period and then begins to turn upward, this often signals that the market has been building energy and may soon break out of consolidation to initiate a new trend.
- ADX Turning Down From High Levels: When ADX retreats from high levels above 50, it does not indicate a trend reversal, but rather suggests that “trend strength is weakening”. A previously strong trend may enter a correction, consolidation, or even a late-stage phase. At this point, traders should consider taking profits in stages or tightening stop-loss levels.
Complete Guide to DMI Parameter Settings: How to Find the Optimal Period?
The effectiveness of any technical indicator is closely related to its parameter settings, and the DMI indicator is no exception. The most important parameter is the lookback period used for calculation.
The Most Common DMI Parameter Setting: Why Does Everyone Use 14 Periods?
The creator of the DMI indicator, Wilder himself, recommended using 14 days periods as the calculation setting in his original design. This parameter has withstood decades of market testing and remains the default setting in most trading software, as well as the standard adopted by most traders. Fourteen days (approximately three weeks of trading days), is considered a cycle that effectively balances sensitivity and stability. It can capture medium- to short-term trend changes while avoiding excessive interference from short-term market noise.
How to Adjust Parameters Based on Different Instruments (Stocks, Futures) and Trading Timeframes (Day Trading, Swing Trading)?
Although 14 periods is the standard, experienced traders fine-tune settings based on their trading style and the characteristics of the instrument to achieve optimal results.
- Short-term traders (e.g., day trading): For short-term traders operating on hourly or even minute charts, a 14-period setting may respond too slowly. They may shorten the parameter, such as to between 7 and 10, to more sensitively capture rapid intraday price fluctuations.
- Swing and long-term traders: For investors using daily or weekly charts for swing trading or long-term positioning, stability in long-term trends matters more. Therefore, they may extend the parameter, such as to between 20 and 28, which filters out more short-term pullbacks or rebounds and focuses on capturing the broader directional trend.
- Instruments with different volatility levels: More volatile instruments (such as certain cryptocurrencies or individual stocks), may require a longer period to smooth price movements and avoid too many false signals. Less volatile instruments (such as certain indices or forex) may try a shorter period to increase sensitivity.
The core principle is that no single parameter setting works for everything. The best DMI parameter settings require traders to continuously backtest and practice to find the “sweet spot” that best fits their trading system.
Practical DMI Strategies: Improve the Quality of Your Trading Decisions
After learning interpretation and settings, the ultimate goal is to integrate the DMI indicator into your trading decisions. Below are two simple and efficient practical strategies to help you turn theory into profits.
Trend-Following Strategy: Enter in the Direction of the DI Crossover When ADX Is Above 25
This is the most classic DMI approach. The core idea is “only trade in the direction of the trend when a trend exists”.
- Condition 1 (Trend confirmation): Wait for ADX to rise from low levels to above 25, confirming that the market has entered a clear trending phase.
- Condition 2 (Directional signal):
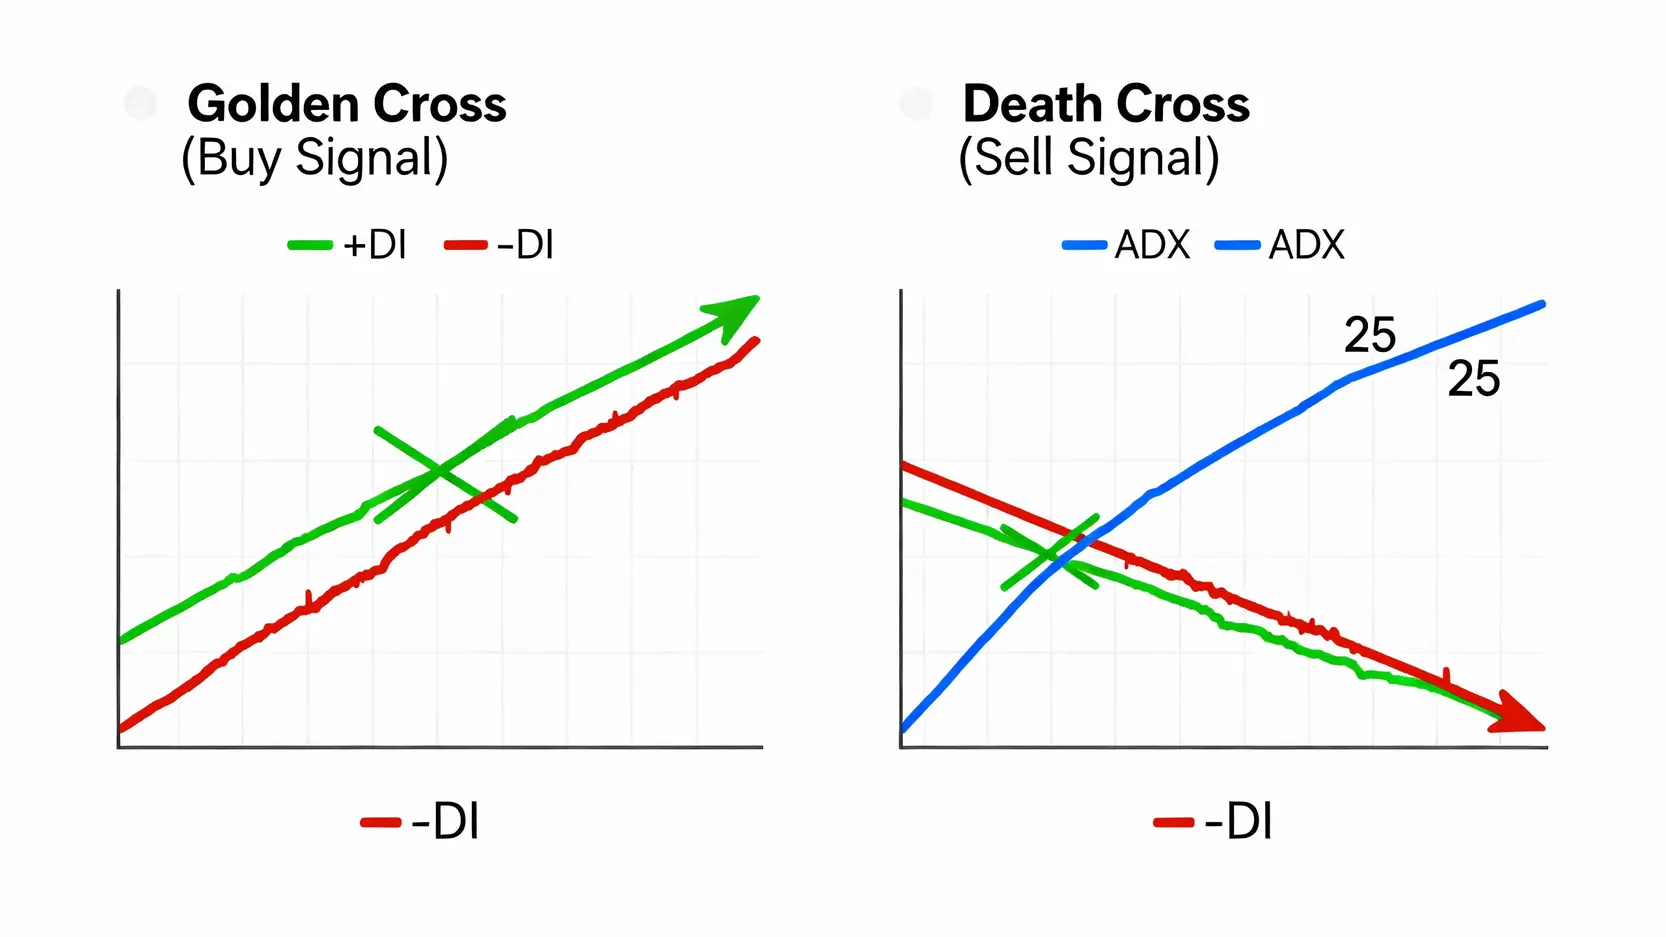
-If +DI crosses above -DI at this time (golden cross), it is treated as a bullish entry signal.
-If DI crosses above +DI at this time (death cross), it is treated as a bearish entry signal.
- Execution and risk control: After entry, stop-loss levels can be set below or above key support or resistance levels. As long as ADX remains elevated and the DI direction does not change, the position can be held. To learn more trend-following strategies, you can refer to related tutorial articles.
Range Filter Strategy: When ADX Is Below 20, Avoid Trendless Ranging Markets
Sometimes, “not trading” is the best trade. The ADX line in the DMI indicator is your best friend for making “do not trade” decisions.
- Strategy core: Add a rule to your trading system: when ADX is below 20 (or 25, can be set manually), pause all “trend-based” trading strategies.
- Advantage: This simple filter helps you avoid ranging markets, which are most likely to cause losses. In such conditions, prices whipsaw back and forth, and trend indicators continuously generate false signals that result in repeated stop-outs. By filtering with ADX, you can significantly reduce ineffective trades and protect your capital.
Frequently Asked Questions About the DMI Indicator (FAQ)
Q: What Are the Advantages and Disadvantages of the DMI Indicator?
A: The advantage is that it is a very comprehensive trend analysis system, providing both trend direction (+DI vs -DI) and trend strength (ADX) information. It can effectively filter out ranging markets and is particularly suitable for trend-following traders. The disadvantage is that it is a lagging indicator. Signals appear later than actual price turning points, which may cause traders to miss the very beginning of a trend. In addition, it reacts relatively slowly during fast V-shaped reversals.
Q: Is the DMI Indicator Suitable for All Financial Instruments?
A: Yes. The DMI indicator has a very wide range of applications and is suitable for all trending financial instruments, including stocks, futures, forex, and cryptocurrencies. Its core logic is to capture price momentum. As long as an instrument’s price forms trends, DMI can be used for analysis. However, parameters should be adjusted appropriately to account for the volatility characteristics of different instruments.
Q: At What ADX Value Is a Trend Considered Strong?
A: General market consensus is that when the ADX value exceeds 25, the trend can be considered established. Values between 25 and 50 indicate a healthy trend. When ADX exceeds 50, it suggests the market is in a very strong trend, often referred to as a “major advancing phase” or “major declining phase”. However, it should be noted that extremely high ADX values (such as above 75), may indicate an overheated trend with the risk of exhaustion.
Q: Can the DMI Indicator Be Used on Its Own?
A: Although DMI is a relatively complete system, any single technical indicator has its limitations. It is recommended to combine the DMI indicator with other analytical tools to improve decision accuracy. For example, it can be paired with moving averages (MA) to confirm the primary trend direction, or combined with price action (such as support and resistance levels or candlestick patterns) to identify more precise entry points.
Conclusion
In summary, the DMI indicator is a powerful tool for identifying market direction, while the ADX Average Directional Index serves as a perfect complement for measuring the reliability of that trend. Learning to combine the two not only allows you to accurately master DMI indicator usage, but also helps you find your own trading rhythm through optimized DMI parameter settings. Adding this powerful trend strength indicator to your analytical toolkit can significantly enhance your ability to capture trending markets and effectively avoid the risks of ranging conditions. Start your trend-following trading journey now!