2026 Gold Technical Analysis: Key 4100-4115 Resistance

Updated: 2026/07/24  |  CashbackIsland

gold-technical-analysis-2026

2026 Gold Technical Analysis: Decisive Battle at the 4100-4115 Resistance Zone and Trend-Following Short Strategy

Amid intense volatility in global financial markets, gold, as a traditional safe-haven asset, has become a key focus for countless traders. Recently, gold prices have approached the critical 4100-4115 resistance zone, leaving market sentiment tense. Blindly chasing highs can easily lead to being trapped, while shorting too early raises the risk of being caught by a strong breakout. This article provides an in-depth analysis of the underlying logic behind gold’s resistance test, while combining gold technical analysis with macro fundamentals to help you find the most stable trading rhythm in the battle between bulls and bears, and accurately capture rebound confirmation signals. 


Why Is 4100-4115 the Current Core Resistance Zone for Gold?

In gold trading, the formation of resistance levels is not accidental. It is a deep imprint left by the long-term battle between bulls and bears. The 4100-4115 range is precisely the gold resistance test area that we need to closely monitor at present.

  • Analysis of Historical High-Volume Price Zones: Looking back at past charts, it is clear that the 4100-4115 range has played an important role multiple times. A large number of positions accumulated here. When prices rebound to this level again, previously trapped long positions are eager to exit at breakeven, while profitable short positions also choose to close positions here, creating strong selling pressure.
  • Confluence of Fibonacci Retracement and Psychological Round-Number Levels: The Fibonacci retracement level from the previous high happens to fall near this area. Together with the psychological effect brought by the round-number level of 4100, the two create a strong confluence, further reinforcing the validity of this resistance zone.


Three Classic Scenarios and Responses for Gold Resistance Tests

When facing a key resistance zone, the market’s reaction is often dramatic. Understanding the outcome of a resistance test is the prerequisite for formulating a trading strategy.

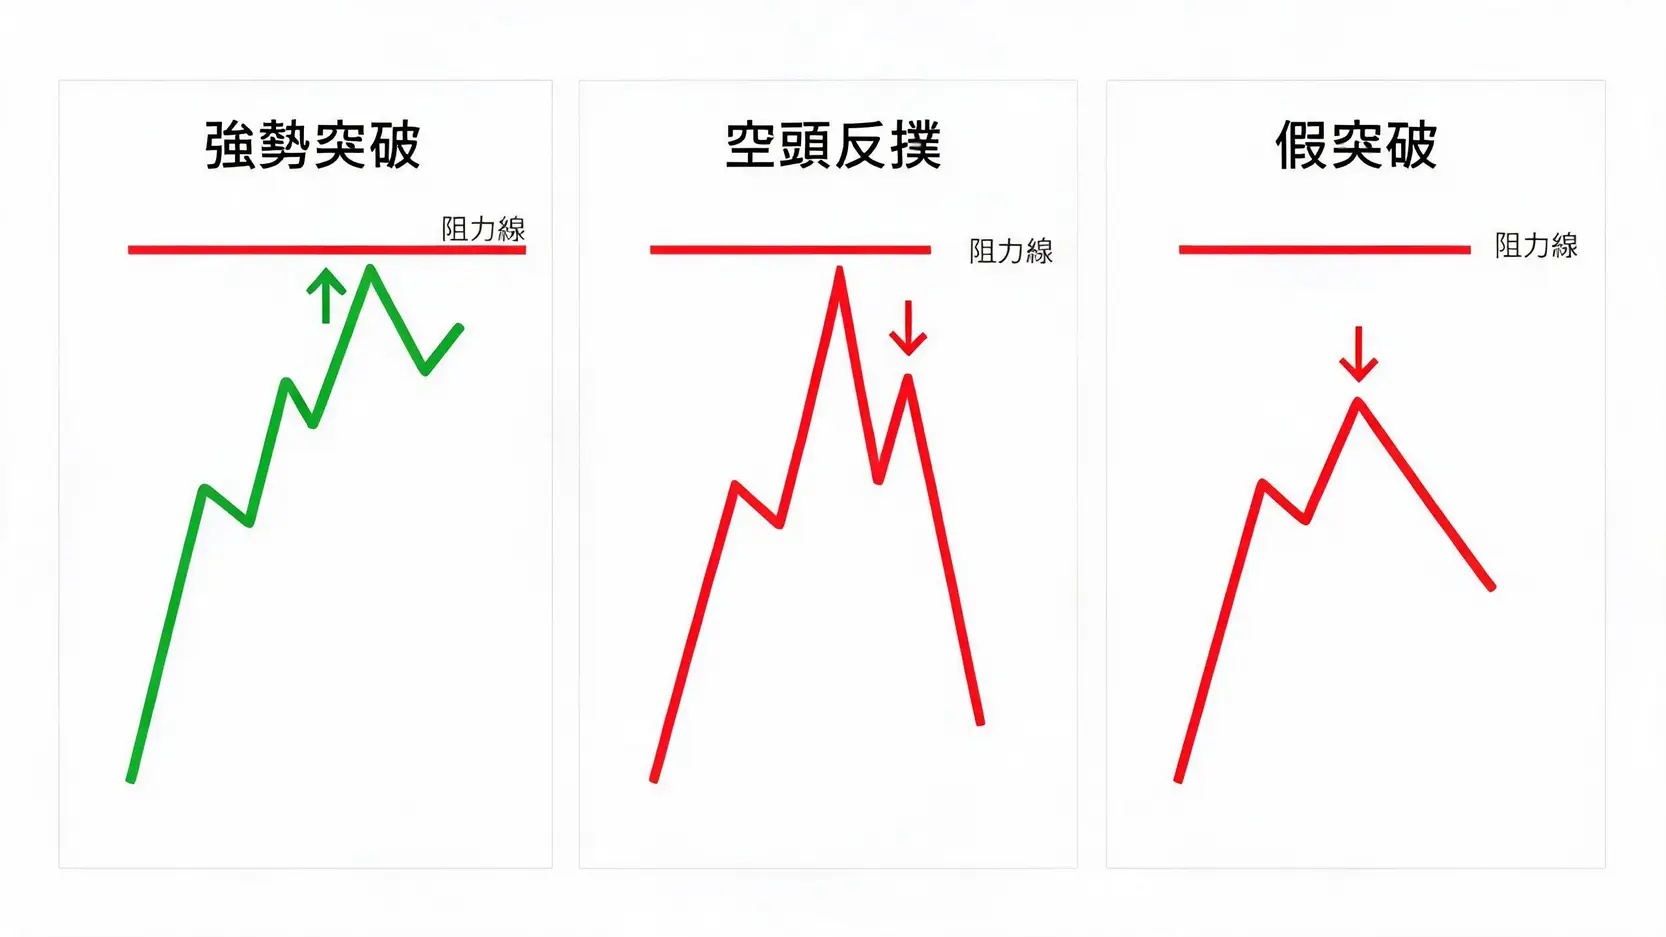
黃金壓力位測試的三種經典K線走勢情境:強勢突破、空頭反撲與假突破

Three Classic Scenarios for Gold Resistance Tests

Scenario 1: Strong Breakout and Pullback Confirmation

If gold prices break strongly above 4115 with huge trading volume and a large bullish candlestick body, this means bulls have absolute control. At this point, you should avoid blindly picking the top and shorting. Instead, adopt a right-side trading mindset and wait for the price to pull back to the 4100-4115 range (where resistance has now turned into support). If the level holds, you can then position for long trades.

Scenario 2: Bearish Counterattack After Touching the Resistance Level

This is the most common scenario. As soon as the price touches the resistance zone, it encounters heavy selling and forms a candlestick with a long upper shadow. This shows that overhead pressure is heavy and that major bearish forces have built a strong defensive position here. This is often an excellent signal for trend-following shorting.

Scenario 3: Market Maker Shakeout or Real Breakout? Read the Candlesticks and Volume

Near resistance levels, major players often create false breakout traps to lure bulls in. The key lies in observing trading volume: if the breakout happens on shrinking volume, there is a high probability that it is a false breakout. If the price quickly falls back below the resistance level after the breakout and forms an “engulfing pattern”, it is a clear topping signal.


Further Reading (Highly Recommended)

Gold Under Pressure: How Rising Oil Prices and a Stronger US Dollar Create a Double Blow to Gold Prices?

Fed Hawkishness Pressures Gold: How Rising Rate Hike Expectations Could End the Gold Bull Market?


Mastering a Gold Bearish Trend: A Guide to Trend-Following Short Strategies

In the gold market, “trading with the trend” is a timeless principle. Once a bearish gold trend takes shape, blindly buying the dip often leads to painful losses. Learning to identify a bearish market structure is the key to generating consistent profits during a downtrend.

The technical characteristics of a confirmed bearish gold trend are mainly reflected in a topping structure and a continuous pattern of lower highs and lower lows. When the price breaks below a key long-term support level, such as the 200-day moving average, it often signals the exit of long-term capital and confirms the bearish trend. Under these conditions, opening short positions when price rebounds into resistance, or waiting for a moving average death cross and a downside breakout before shorting, are strategies with a relatively higher probability of success. At the same time, traders must remain alert to sharp countertrend rallies, commonly known as a “short squeeze”, which can occur even in a bearish market.


Reject Bull Traps! Accurately Capture Rebound Confirmation Signals

After a sharp drop in gold prices, many traders are eager to buy the dip, but often end up trapped halfway down. The key question is whether what you are seeing is a real bottom reversal or a short-lived “dead cat bounce”.
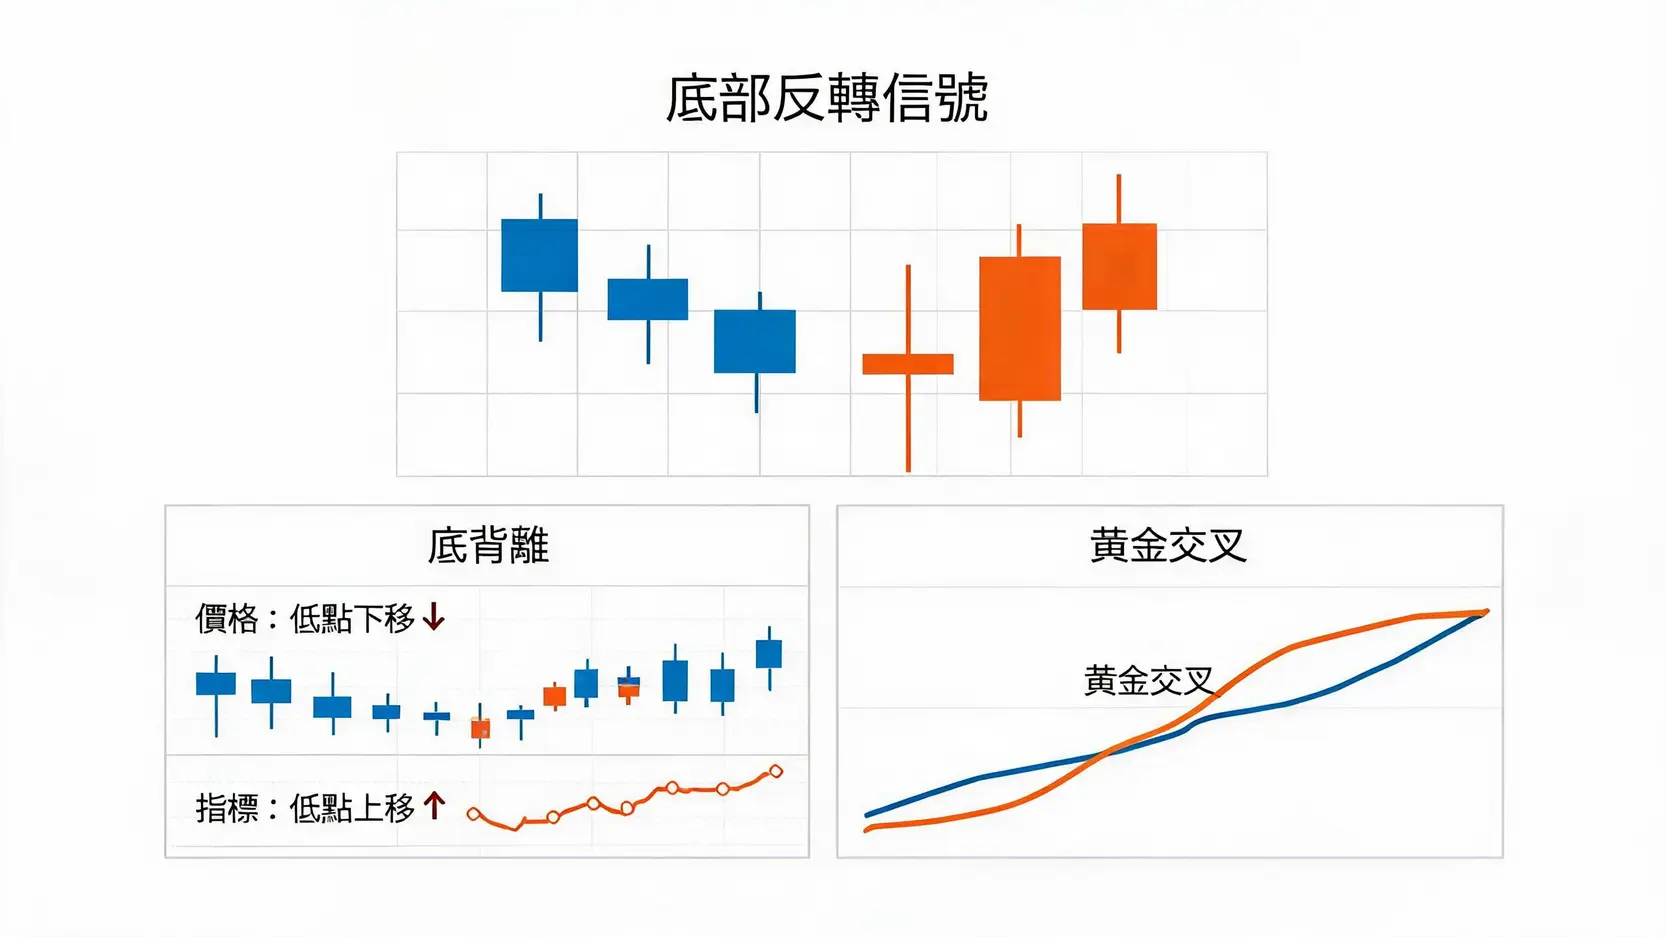
黃金底部反彈確認信號:K線型態結合指標底背離與黃金交叉

Technical Indicator Confluence Signals for Accurately Capturing Bottom Rebounds

  • Appearance of a Single-Day Reversal Candlestick: After a continuous decline, if a hammer candlestick or bullish engulfing pattern appears, accompanied by unusually high volume at the bottom, this is often an initial signal that major capital is entering the market to support prices.
  • Double Confirmation From RSI and MACD: Looking at candlesticks alone can easily lead to false signals, so indicators must be used together. When technical indicators such as RSI move out of the oversold zone and form bullish divergence, while MACD forms a golden cross below the zero line, the rebound confirmation signal becomes more credible. A weak rebound without volume support is usually just a continuation pattern within the downtrend.


Macro Perspective: Cross-Market Analysis of US Treasuries, the US Dollar, and Gold Technicals

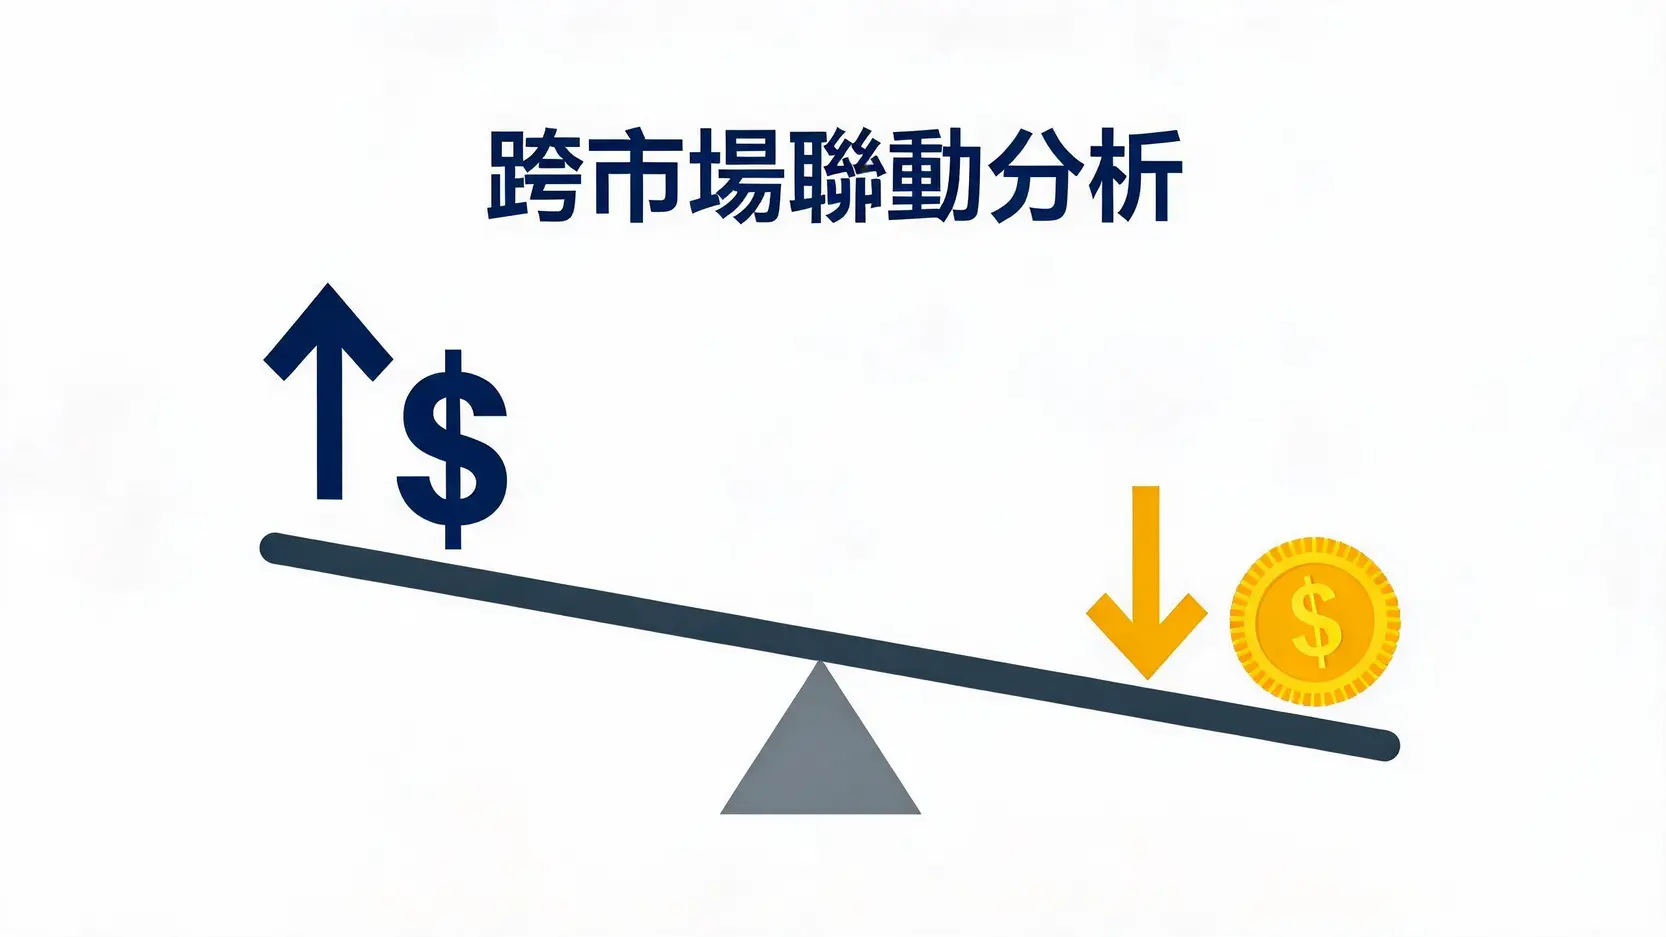
Looking only at candlestick charts can sometimes make it difficult to see the full market picture. Behind a bearish gold trend, there is often a powerful macro fundamental force. A strong US dollar (DXY) creates natural resistance for gold, while rising real interest rates are an even more fatal blow to non-interest-bearing gold. When gold technicals show a rebound, but the US dollar remains strong and US Treasury yields stay elevated, we should remain highly cautious about the sustainability of the rebound. This helps us filter out false rebound confirmation signals. Cross-checking fundamentals and technicals with reference to authoritative data sources is an essential skill for mature traders.

美元、收益率與黃金價格之間的跨市場負相關關係

The See-Saw Effect Between the US Dollar, Treasury Yields, and Gold Prices


Capital Management and Defensive Strategies in a High-Volatility Market

When testing key resistance levels such as 4100-4115, market volatility can become extremely intense. Even if you correctly predict the direction, poor position management can easily result in being stopped out.

Heavily betting on a single breakout direction is one of the biggest trading mistakes, while setting stop losses too tightly often leads to repeated stop-outs. A staggered position-building strategy is recommended: establish a small exploratory position near the resistance zone first. If the price pulls back as expected, add to the position based on rebound confirmation signals. If a false breakout occurs, your losses can still be kept within an acceptable range. Properly calculating the risk-to-reward ratio is the core of trading around resistance levels.

Conclusion

The gold market in 2026 is full of both opportunities and challenges. As gold tests the 4100-4115 resistance zone, traders need to combine gold technical analysis with macro cross-market data to objectively assess the balance between bullish and bearish forces. Whether following the trend by shorting or looking for a bottom reversal, strict capital management and patiently waiting for rebound confirmation signals remain indispensable. Eliminate subjective assumptions and ensure every trade is backed by clear evidence. Only then can you stand firm in this highly unpredictable market.


Frequently Asked Questions (FAQ)

What does it mean when gold consolidates near a resistance level?

This usually indicates that bulls and bears are engaged in an intense battle, with market forces temporarily in balance. The longer the consolidation lasts, the stronger the momentum is likely to be once a breakout occurs. Traders should remain patient and wait for a clear directional candlestick before taking action.

Does a resistance level become a support level after it is broken?

Yes. This is the well-known “support and resistance role reversal” principle in technical analysis. After a valid breakout, the former resistance level that capped price gains becomes a support level that helps prevent further declines.

Where should I place my stop loss when trading around the 4100-4115 resistance zone?

A stop loss should not be placed at a fixed price distance mechanically. Instead, it should be based on the technical structure. If you are shorting within the 4100-4115 zone, a reasonable stop loss can be placed above the recent false breakout high or with a sufficient buffer above 4115 to avoid being stopped out by market manipulation.

How can I distinguish between a rebound and a trend reversal?

A rebound usually occurs within a bearish trend, lacks sustained volume support, and fails to break above the previous major resistance level. A trend reversal, on the other hand, requires not only the formation of a bottoming pattern, but also support from macroeconomic fundamentals, along with a decisive breakout and sustained move above the long-term descending trendline.

编者
Evan Lin

Evan Lin

我是Evan Lin,从大学时期开始接触外汇交易,至今已有多年实战经验,熟悉技术分析与EA策略,热衷于研究市场脉动与风险管控,喜欢分享实战经验和交易技巧,和大家一起学习、一起进步!

If you liked this article, please share it!

Related Articles

  • Oil Prices and USD/CAD: 2026 Correlation Trading Guide
    Bullish Oil Prices Mean You Should Short USD/CAD? A Complete 2026 Trader’s Guide to the Correlation Between the Canadian Dollar and Crude Oil Introduction When international oil prices surge and the market is filled with “bullish oil price” news, many traders instinctively react by shorting USD/CAD. But does this strategy...
    2026 年 7 月 27 日
  • Geopolitical Trading: 4 High-Probability Strategies for 2026
    Turn Crisis Into Opportunity: Four Core Strategies for High-Probability Trading Setups Amid Geopolitical Wars Global geopolitical risks have continued to intensify in 2026, from tense confrontations in Eastern Europe to sporadic conflicts in the Middle East. Any geopolitical war could instantly trigger extreme volatility in financial markets. Many investors feel...
    2026 年 7 月 27 日
  • Fuh Hwa vs. UBS Strategic Allocation Funds Compared
    【Strategic Allocation Fund Comparison】Fuh Hwa vs. UBS: Understand the Differences, Performance, and Risks of Popular Funds at a Glance! Faced with complex and ever-changing financial markets, are you still struggling with how to build an investment portfolio that can effectively diversify risk and achieve steady growth? A “Global Strategic Allocation...
    2026 年 7 月 27 日
返回顶部