Gold-Silver Ratio: Strategy, Calculation & Timing

Updated: 2026/04/20  |  CashbackIsland

gold-silver-ratio-investing

Gold-Silver Ratio Investment Strategy: How Is It Calculated? How to Interpret It? How to Capture the Best Entry and Exit Timing for Gold and Silver

Faced with market volatility, many investors hesitate between “buying gold or buying silver”. In reality, professional investors rely on a key indicator, the “gold-silver ratio” to assess the relative value between the two. This ratio not only reveals the price relationship between gold and silver, but also serves as a crucial foundation for developing a sophisticated gold-silver ratio investment strategy. This article will clearly explain how the gold-silver ratio is calculated and provide a complete practical framework to help you understand when to buy gold and when to buy silver. It will also analyze the long-lasting impact of silver industrial demand, helping you make more rational precious metals investment decisions.


What Is the Gold-Silver Ratio? Why Is It a Key Indicator for Gold and Silver Investment?

The gold-silver ratio is a simple yet powerful analytical tool that shows how many ounces of silver are needed to purchase one ounce of gold. It is a core indicator for measuring the relative value of the two precious metals. When the ratio rises, silver becomes cheaper relative to gold. When it falls, silver becomes more expensive relative to gold. For investors seeking to trade precious metals tactically, understanding and tracking the gold-silver ratio is essential. 


Definition and Formula of the Gold-Silver Ratio (How It Is Calculated)

The calculation of the gold-silver ratio is straightforward:

Gold-Silver Ratio = Gold Price (per ounce) / Silver Price (per ounce)

金銀比計算公式的示意圖,顯示黃金價格除以白銀價格等於金銀比。

Silver Price Calculation Formula

For example, assume the current price of gold is US$2,400 per ounce, and the price of silver is US$30 per ounce. Then the gold-silver ratio is:

2400 / 30 = 80

This means that at this moment, you need 80 ounces of silver to exchange for 1 ounce of gold. The number “80” is the current gold-silver ratio. Investors can easily find real-time gold and silver prices on major financial websites and calculate the latest gold-silver ratio at any time.


Historical Trends of the Gold-Silver Ratio: What Do the Highs and Lows Represent?

Looking back at history, the gold-silver ratio is not a fixed number. It fluctuates significantly depending on market sentiment, economic conditions, and supply-demand dynamics. Understanding its historical trends provides valuable reference for investment decisions:

  • Historical lows: In history, the gold-silver ratio has fallen below 20, which usually occurs during periods of sharp silver price surges. For example, during the Hunt Brothers’ attempt to corner the silver market in 1980, the ratio dropped to around 17. An extremely low ratio suggests that silver may be overvalued relative to gold.
  • Historical highs: Conversely, during economic recessions or financial crises, gold’s safe-haven demand far exceeds that of silver, causing the ratio to surge. For example, during the early stages of the COVID-19 pandemic in 2020, market panic pushed the gold-silver ratio to a historical high above 120. This indicates that gold significantly outperformed silver, and silver was relatively undervalued.
  • Historical average: Over the past decades, the long-term average of the gold-silver ratio has generally ranged between 50 and 70. Many analysts consider this range a relatively “normal” or “balanced” level.

Therefore, when the gold-silver ratio deviates significantly from its historical average, it may signal potential trading opportunities. High levels may indicate a buying opportunity for silver, while low levels may suggest that gold is relatively more attractive.


Extended Reading (Highly Recommended)

Gold Investment Beginner Guide: Full Breakdown of 5 Methods, Pros and Cons, and Investment Risks


How to Apply the Gold-Silver Ratio Investment Strategy? 2 Practical Approaches

After understanding the basic concept of the gold-silver ratio, the next step is how to apply it in real investing. The core logic of the gold-silver ratio investment strategy is “mean reversion” which assumes that the ratio will eventually revert from extreme levels back to its historical average. Below are two main practical approaches.

金銀比投資策略流程圖,說明在高比率時買入白銀,在低比率時買入黃金的決策過程。

Gold-Silver Ratio Strategy Based on High and Low Levels


Strategy 1: When the Gold-Silver Ratio Is High, Why Is It a Good Time to Buy Silver?

When the gold-silver ratio rises to a historical high (for example, 80 or above), it means silver is extremely cheap relative to gold, or that its value is undervalued by the market. At this point, investors may consider the following actions:

  1. Directly buying silver: If you hold cash, this is a good opportunity to buy physical silver, silver ETFs, or related mining stocks. When the ratio eventually declines from its peak, silver is expected to outperform gold, potentially generating higher returns.
  2. Switching gold to silver: If you already hold gold, you may consider selling part of your gold and using the proceeds to buy equivalent silver. For example, when the ratio is 80, selling 1 ounce of gold allows you to buy 80 ounces of silver. If the ratio later falls to 60, converting those 80 ounces of silver back would give you 1.33 ounces (80/60) of gold, effectively increasing your gold holdings.

This strategy is supported by the fact that silver, in addition to being a precious metal, also has strong industrial demand, which provides long-term price support and often allows it to outperform gold during economic recoveries.


Strategy 2: When the Gold-Silver Ratio Falls to Low Levels, Is Gold the More Stable Safe-Haven Choice?

When the gold-silver ratio falls to a historical low (for example, 50 or below), the situation is reversed. This suggests silver is relatively expensive and potentially overvalued. In this case, the strategy shifts toward the more stable asset, gold:

  1. Switching silver to gold: If you previously accumulated silver at higher ratio levels, this may be a good time to take profits and rotate into gold. This not only locks in gains but also shifts capital into a less volatile and stronger safe-haven asset.
  2. Prioritizing gold: If you are waiting to enter the market, buying gold directly in a low-ratio environment is generally safer. Silver’s industrial nature makes it more vulnerable during economic downturns, while gold tends to better preserve value as the ultimate safe-haven asset.

Overall, the gold-silver ratio investment strategy provides a dynamic framework for adjusting exposure between gold and silver, aiming to profit from their relative value fluctuations.


Key Factors Affecting the Gold-Silver Ratio: Beyond Price, What Else Matters?

Although the gold-silver ratio is calculated using only the prices of two metals, the forces driving those prices are highly complex. To better predict ratio movements, it is essential to understand these underlying factors.


Silver’s Dual Nature: How Industrial Demand Affects Silver Prices

Silver differs from gold mainly in its “dual nature”. It is both a precious metal and a critical industrial metal. More than half of global silver supply is used in industrial manufacturing, making silver industrial demand a key variable that determines its price and the movement of the gold-silver ratio.

白銀與黃金屬性對比圖,顯示黃金主要用於避險,而白銀同時具有避險和大量的工業需求(如太陽能、電動車、電子產品)。

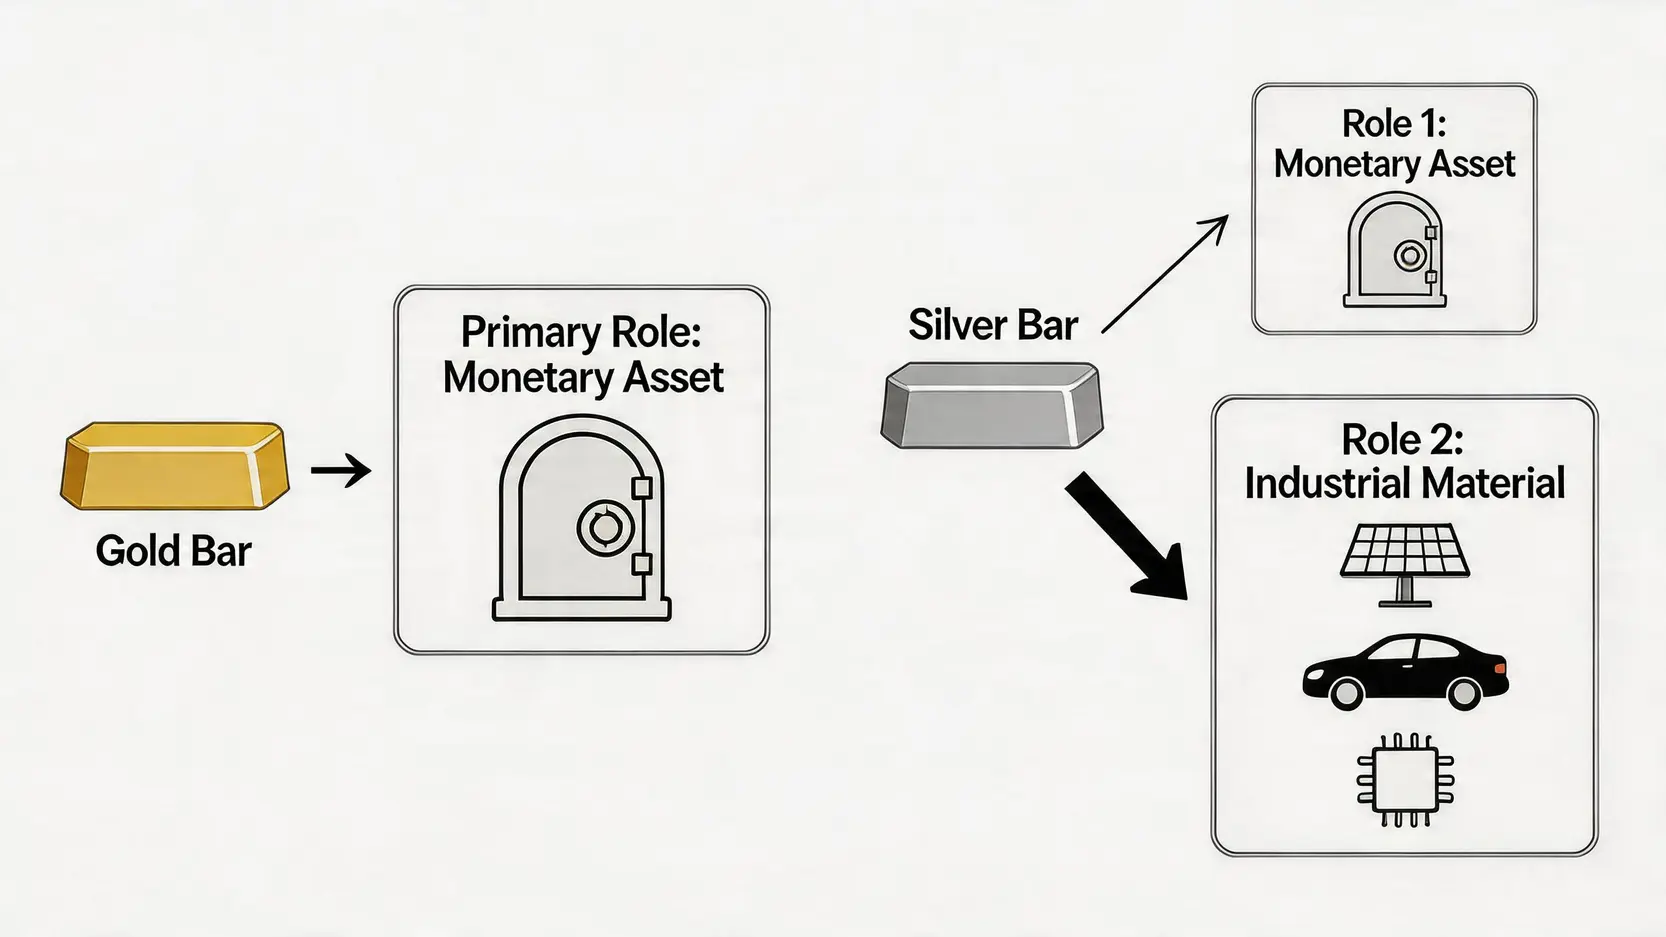
Silver’s dual nature: combining industrial and safe-haven value

  • Green energy revolution: Silver is an essential conductive material used in solar panels (photovoltaics). As global investment in renewable energy continues to rise, demand for solar panels has surged, directly driving strong demand for silver.
  • Electric vehicle (EV) industry: EV electronic components, batteries, and charging infrastructure all contain significant amounts of silver. Each electric vehicle uses far more silver than a traditional internal combustion vehicle. The rapid growth of the EV market provides long-term upward momentum for silver demand.
  • 5G and electronics: As the most conductive metal, silver plays a crucial role in 5G infrastructure, smartphones, computers, and other high-tech products.

Because industrial demand accounts for a large share of total usage, silver prices are closely tied to global economic conditions. During economic expansion, strong industrial demand may allow silver to outperform gold, causing the gold-silver ratio to decline. Conversely, during economic recessions, weakening industrial demand may cause silver to fall more sharply than gold, pushing the ratio higher. Authoritative institutions such as The Silver Institute regularly publish reports on silver supply and demand, serving as key references for investors.


Macroeconomic indicators: the role of the US dollar and interest rate policy

In addition to silver’s own industrial demand, macroeconomic conditions also play a decisive role in the gold-silver ratio.

  • US Dollar Index (DXY): Gold and silver are generally priced in US dollars. In most cases, a stronger US dollar puts downward pressure on precious metals, while a weaker dollar supports them. However, since gold has stronger financial attributes, it is usually more sensitive to the US dollar than silver. Monitoring the US dollar index helps investors assess overall trends in the precious metals market.
  • Interest rates: Gold and silver are non-yielding assets. When central banks (especially the US Federal Reserve) raise interest rates, the opportunity cost of holding cash or bonds decreases, which reduces the attractiveness of precious metals. Conversely, when interest rates are cut or monetary easing is implemented, the value-preserving role of precious metals becomes more prominent, often attracting greater capital inflows.

Overall, a successful gold-silver ratio investor must not only be able to calculate the ratio but also think like a detective, closely monitoring silver’s industrial outlook and global macroeconomic trends.


Extended Reading (Highly Recommended)

Gold Investment Beginner Guide: Full Breakdown of 5 Methods, Pros and Cons, and Investment Risks


Gold-Silver Ratio Investment Strategy FAQ

What is the “reasonable” historical average range of the gold-silver ratio?

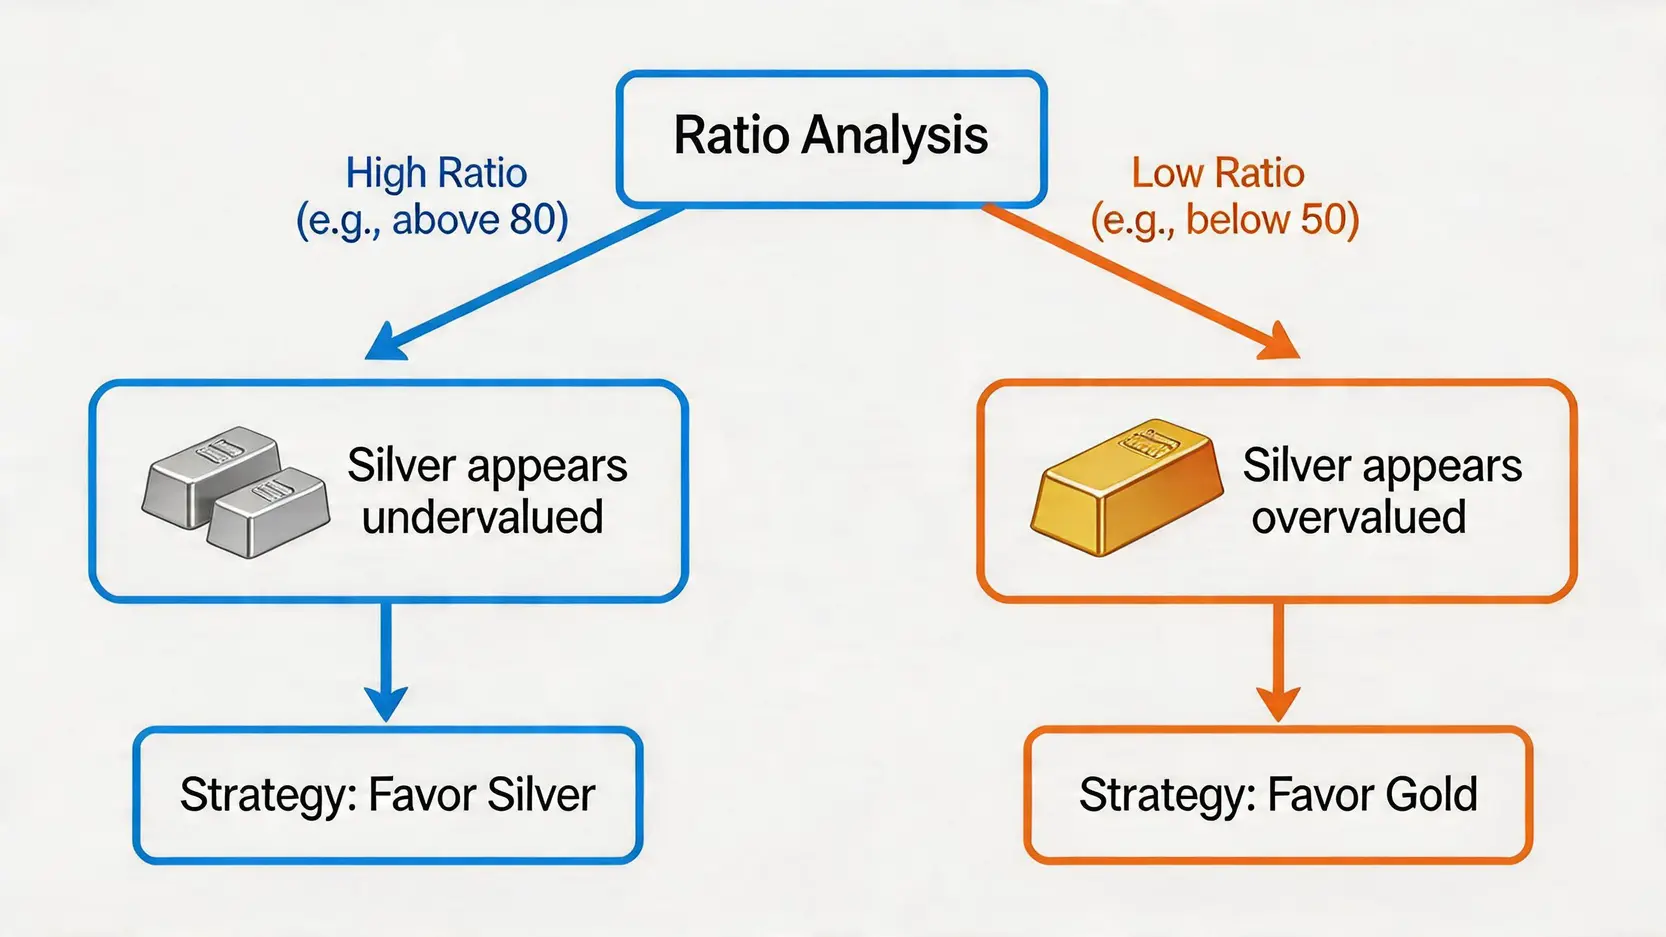
Although there is no absolute “correct” level, looking at data over the past half century, the long-term average of the gold-silver ratio generally falls within the range of 50 to 70. Many analysts use this range as a reference benchmark. When the ratio rises significantly above 70 to 80, it is often seen as a signal that silver is undervalued. When the ratio falls below 50, it may suggest that silver is relatively expensive compared to gold.

What is the outlook for silver industrial demand (such as solar energy and electric vehicles)?

The outlook is very positive. As global efforts to combat climate change intensify, the “green transition” has become an irreversible trend. Solar energy and electric vehicles are central to this transformation, and both industries are major consumers of silver. Over the next decade, silver industrial demand from these sectors is expected to remain strong, providing solid fundamental support for silver prices.

Besides the gold-silver ratio, what other factors should be considered?

The gold-silver ratio is a very useful reference indicator, but it should not be the only decision-making tool. When investing, other factors should also be considered, including global macroeconomic conditions (such as GDP growth and inflation), central bank monetary policy, geopolitical risks, market sentiment, and US dollar movements. A comprehensive analytical framework helps improve investment outcomes.

Is investing in silver riskier than investing in gold?

Yes, generally speaking, silver price volatility is higher than that of gold. This is mainly due to its smaller market size and higher proportion of industrial demand. During periods of strong market fluctuations, silver prices tend to move more sharply than gold prices. Therefore, investors should fully understand its higher risk profile and make allocation decisions based on their own risk tolerance.


Conclusion

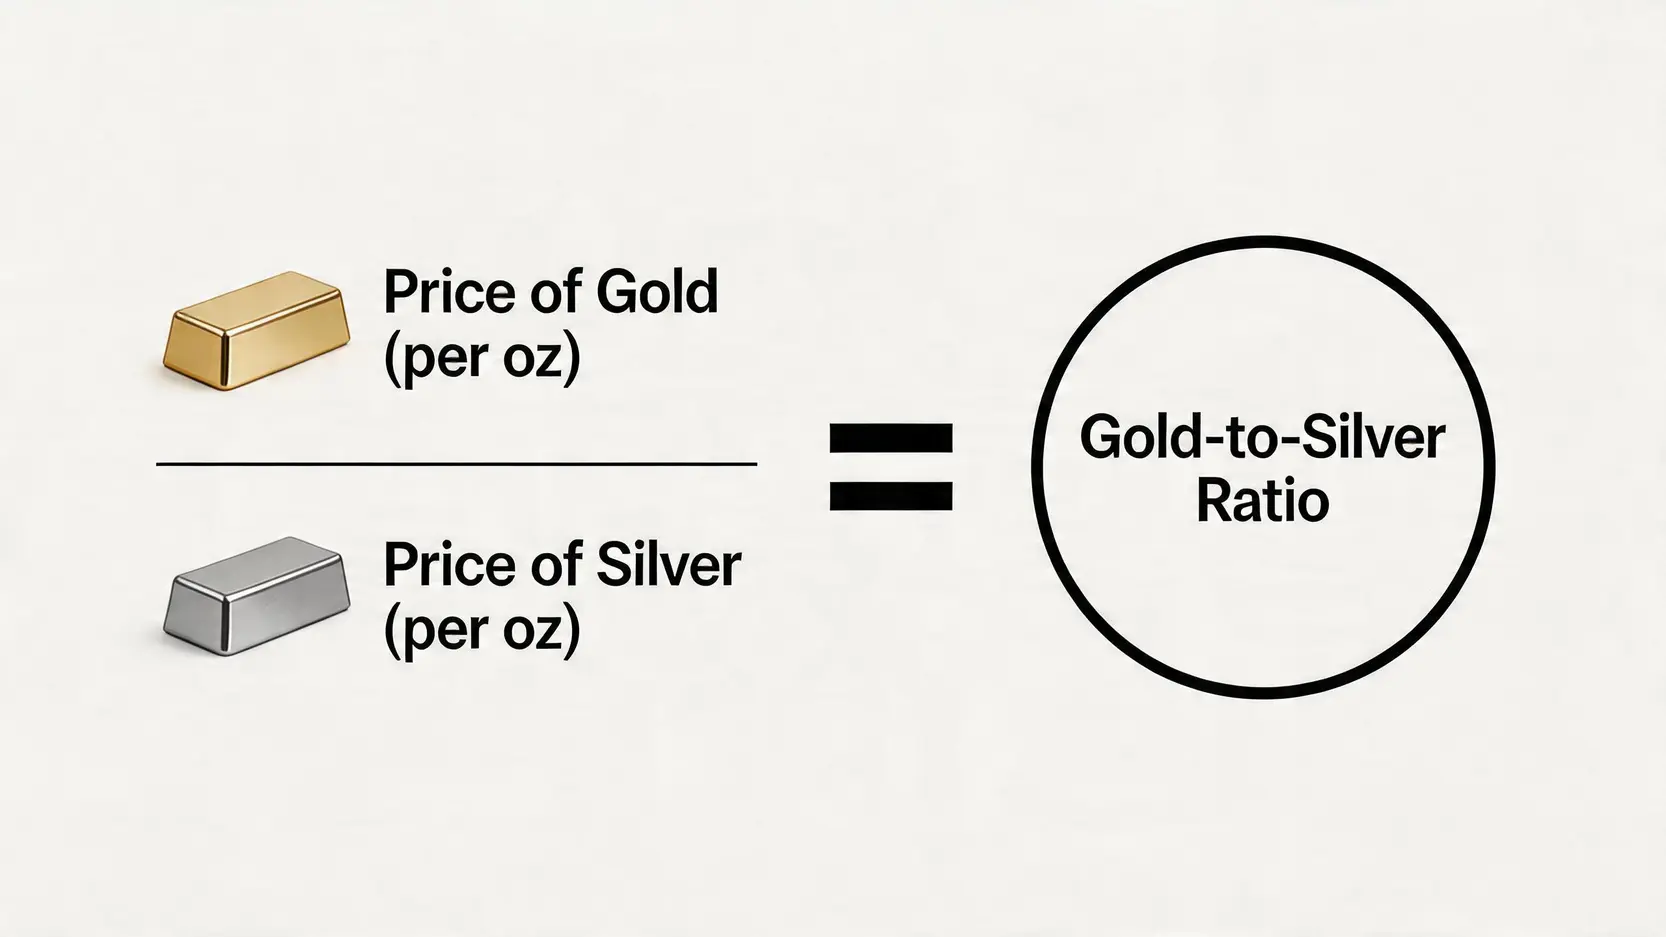
In summary, mastering the gold-silver ratio investment strategy is a key step in solving the question of “whether to buy gold or silver”. By understanding the simple method of how to calculate the gold-silver ratio and its deeper historical significance, and by combining analysis of multiple factors such as silver industrial demand and macroeconomic conditions, investors can more effectively evaluate the relative value of gold and silver and identify potential trading opportunities at extreme ratio levels. Whether you are a conservative investor seeking asset preservation or an aggressive investor aiming for higher returns, incorporating the gold-silver ratio into your analytical toolkit will help you navigate the precious metals market more effectively and make more informed investment decisions.

If you liked this article, please share it!

Related Articles

  • Volatility Surface Guide: Skew Trading Strategies
    Practical Applications of Volatility Surfaces: From Options Modeling to Advanced Skew Trading Strategies In options markets, implied volatility is never a flat line. Instead, it forms complex "smile" or "skew" surfaces. For advanced traders, mastering the practical applications of volatility surfaces is equivalent to possessing a lens that reveals market...
    2026 年 6 月 3 日
  • Foreign Capital Flow Model: Track Institutional Money
    Building a Foreign Capital Flow Copy Trading Model: A Stock Market Indicator for Accurately Tracking Institutional Positioning In Asia-Pacific stock markets, foreign capital inflows and outflows often determine the direction of the index. However, simply looking at daily net buy and sell data is no longer enough. Only by building...
    2026 年 6 月 3 日
  • Options Buying Strategies for Extreme Market Risks
    Options Buyer Strategies During Extreme Market Conditions: Black Swan Hedging and Cross-Market Arbitrage During Volatility Surges The most terrifying aspect of financial markets is not a gradual decline, but overnight flash crashes and cross-market capital withdrawals accompanied by volatility surges. In the highly unpredictable global macroeconomic environment of 2026, geopolitical...
    2026 年 6 月 3 日
返回顶部