Economic Data Surprise: 3-Step Trading Strategy

Updated: 2026/04/17  |  CashbackIsland

economic-data-surprise-trading

Economic Data Surprise Value Full Guide: A 3-Step Strategy for Post-Data Release Trading Success

Whenever key economic data such as US Non-Farm Payrolls (NFP) or the Consumer Price Index (CPI) is released, financial markets often experience sharp volatility. Do you often feel caught off guard, watching prices swing up and down without knowing how to react? Successful traders do not profit because they have a crystal ball to predict the future, but because they understand how to systematically interpret the “economic data surprise value” and prepare a well-structured “data release trading strategy” in advance. This article will guide you step by step on how to use “market expectation deployment” to turn seemingly chaotic uncertainty into stable trading opportunities. 


Breaking Down the Core Concept: What Is Economic Data Surprise Value?

Before discussing trading strategies, it is essential to understand the core driver of immediate market reactions: the “economic surprise value”. This is not a complex academic term, but rather a simple measure of the gap between reality and expectations. In short, sharp market movements are not driven by the data itself, but by the difference between the “actual released data” and “market expectations”.


Market Expectations (Consensus) vs. Actual Data: Calculation and Meaning of Surprise Value

Before major data releases, financial media and institutions aggregate forecasts from major banks to form a consensus estimate (Consensus). The surprise value is the measurable difference between the two:

Economic Data Surprise Value = Released Data (Actual) – Market Expectations (Consensus)

  • Positive Surprise: Released data > market expectations. For example, the market expects non-farm payrolls to increase by 180,000 people, while the actual figure is 250,000 people. This is usually positive for the currency and may trigger price increases.
  • Negative Surprise: Released data < market expectations. For example, the market expects CPI year-on-year growth at 3.2%, while the actual result is 2.9%. This may be interpreted as easing inflation, increasing the likelihood of Fed rate cuts, and therefore being negative for the US dollar.

The magnitude of this “surprise” directly determines the intensity of market volatility. The larger the gap, the more violent the price reaction.經濟數據意外值概念圖,展示公布數據與市場預期的三種關係:正意外、負意外與符合預期。

Three Possible Outcomes of Economic Data Surprises and Their Potential Impact on the Market


Why is “surprise” the key? Breaking down how the market prices in expectations in advance

A common misconception is that “good data goes up, bad data goes down”. In reality, the market is a highly efficient information-processing machine. In the days or even weeks before official data is released, savvy investors have already made assumptions and positioned themselves based on various clues (such as preliminary data and official remarks) about the upcoming figures. This is what is known as “price in” or the advance digestion of expectations.

When the data is released:

  • If the data matches expectations, the market reaction is usually very muted, because this outcome has already been reflected in the current price.
  • Only when the data is far above or far below expectations will it break the existing market balance, forcing a large number of traders to reassess asset values and quickly buy or sell, thereby creating significant price volatility. Understanding this layer of market expectations and trading psychology is the foundation for developing effective strategies.


Further Reading (Highly Recommended)

MT5 Forex Trading Ultimate Guide: Platform Recommendations, Analysis Techniques, and Practical Strategies

2026 Forex Trading Beginner Guide: Master Risk Management and Broker Selection for Steady Profits!


Three Main Data Release Trading Strategies in Practice Deployment

After understanding the principle of surprises, the next step is how to translate it into actual trading actions. The following introduces three widely used trading strategies during data-driven markets. Each strategy has its applicable scenarios and risk considerations.


Strategy 1: Breakout Strategy – Following the First Wave After Data Release

This is the most direct and execution-demanding strategy. The core idea is to follow the first strong trend triggered by the data surprise.

  • Deployment Method:
    1. Pre-event preparation: 15-30 minutes before the data release, observe the chart (such as the EUR/USD 5-minute or 15-minute timeframe) and identify the recent consolidation range, including support and resistance levels.
    2. Waiting for the moment: At the instant of data release, price will usually break strongly in one direction.
    3. Trade execution: When the price closes a strong candle (full-bodied body with short wicks) breaking above key resistance or below key support, immediately enters in the same direction. For example, go long when breaking above resistance.
    4. Risk management: Stop Loss is placed at the opposite end of the breakout candle or the other side of the consolidation range. Take Profit can be set at 1.5 to 2 times the risk.
  • Advantages: If the direction is correctly identified, the short-term profit potential is huge.
  • Disadvantages: It is easy to encounter “false breakouts” where price breaks out and then quickly reverses, triggering stop loss. It requires extremely high precision in timing and execution.


Strategy 2: Straddle Strategy – Capturing Large Volatility Regardless of Direction

If you expect strong volatility from the data but are unsure about the direction, the straddle strategy is your best option. This strategy aims to capture movement in either direction.

  • Deployment Method:
    1. Pre-event preparation: About 5-10 minutes before the data release, identify the recent short-term high and low around the current price.
    2. Place pending orders: Set a Buy Stop order about 15-20 pips above the current price, and at the same time set a Sell Stop order about 15-20 pips below the current price.
    3. Automatic activation: After the data release, whichever direction the price moves strongly will trigger one of the orders. Once one order is executed, immediately cancel the other unfilled order.
    4. Risk management: Stop Loss is also placed on the opposite side of the consolidation range. A Trailing Stop can also be used to lock in profits.
  • Advantages: No need to predict direction; as long as volatility is large enough, there is a chance to profit.
  • Disadvantages: If volatility is insufficient, price may whipsaw, triggering one order and then reversing to hit the stop loss, or even causing losses on both sides. Spread will widen significantly during data release, increasing trading costs.

Regardless of the strategy used, strict trading risk management techniques are essential. Do not rely on luck in data-driven markets.

突破交易法與雙向掛單法兩種數據交易策略的對比圖。

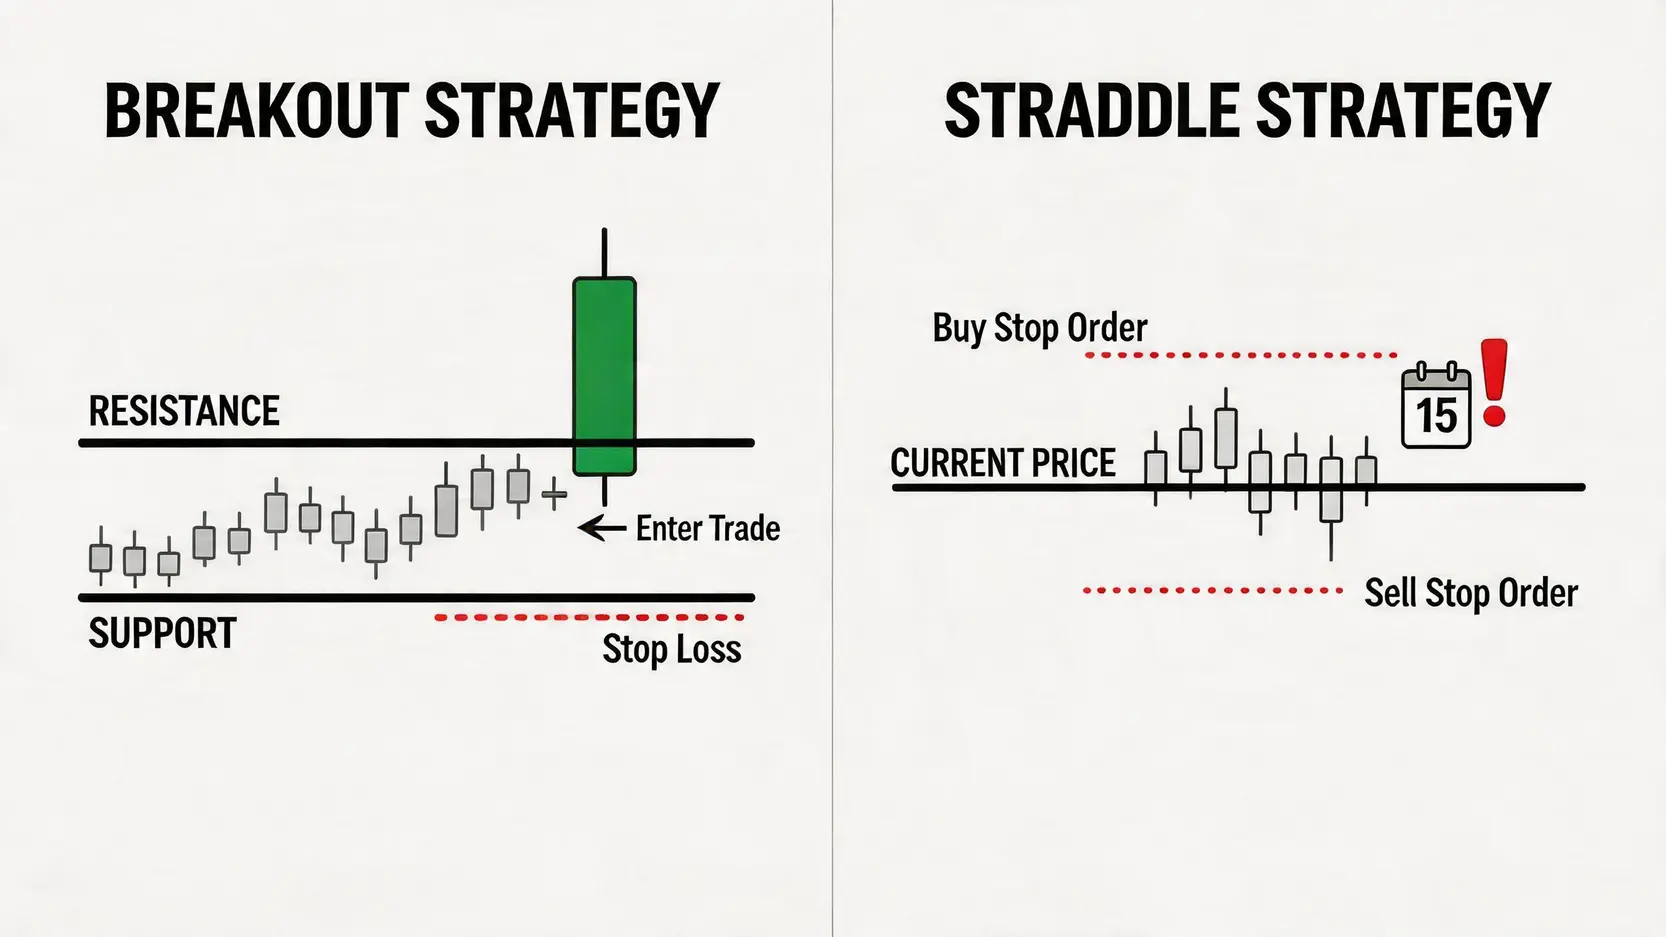
Two Main Data Release Trading Strategies: Breakout vs Straddle


Further Reading (Highly Recommended)

MT5 Forex Trading Ultimate Guide: Platform Recommendations, Analysis Techniques, and Practical Strategies

2026 Forex Trading Beginner Guide: Master Risk Management and Broker Selection for Steady Profits!


Frequently Asked Questions (FAQ)

Q: Where can I check economic data? What are reliable economic calendars?

A: Accessing real-time and accurate economic data is the foundation of trading. It is recommended to use internationally recognized and authoritative economic calendar websites, as they provide the forecast value, previous value, and actual released value, while also indicating the importance level of each release. Some high-quality options include Forex Factory, Investing.com, and DailyFX. Among them, Forex Factory’s economic calendar is widely favored by global traders for its clean interface and high community activity.

Q: Why does the market sometimes fall after positive economic data?

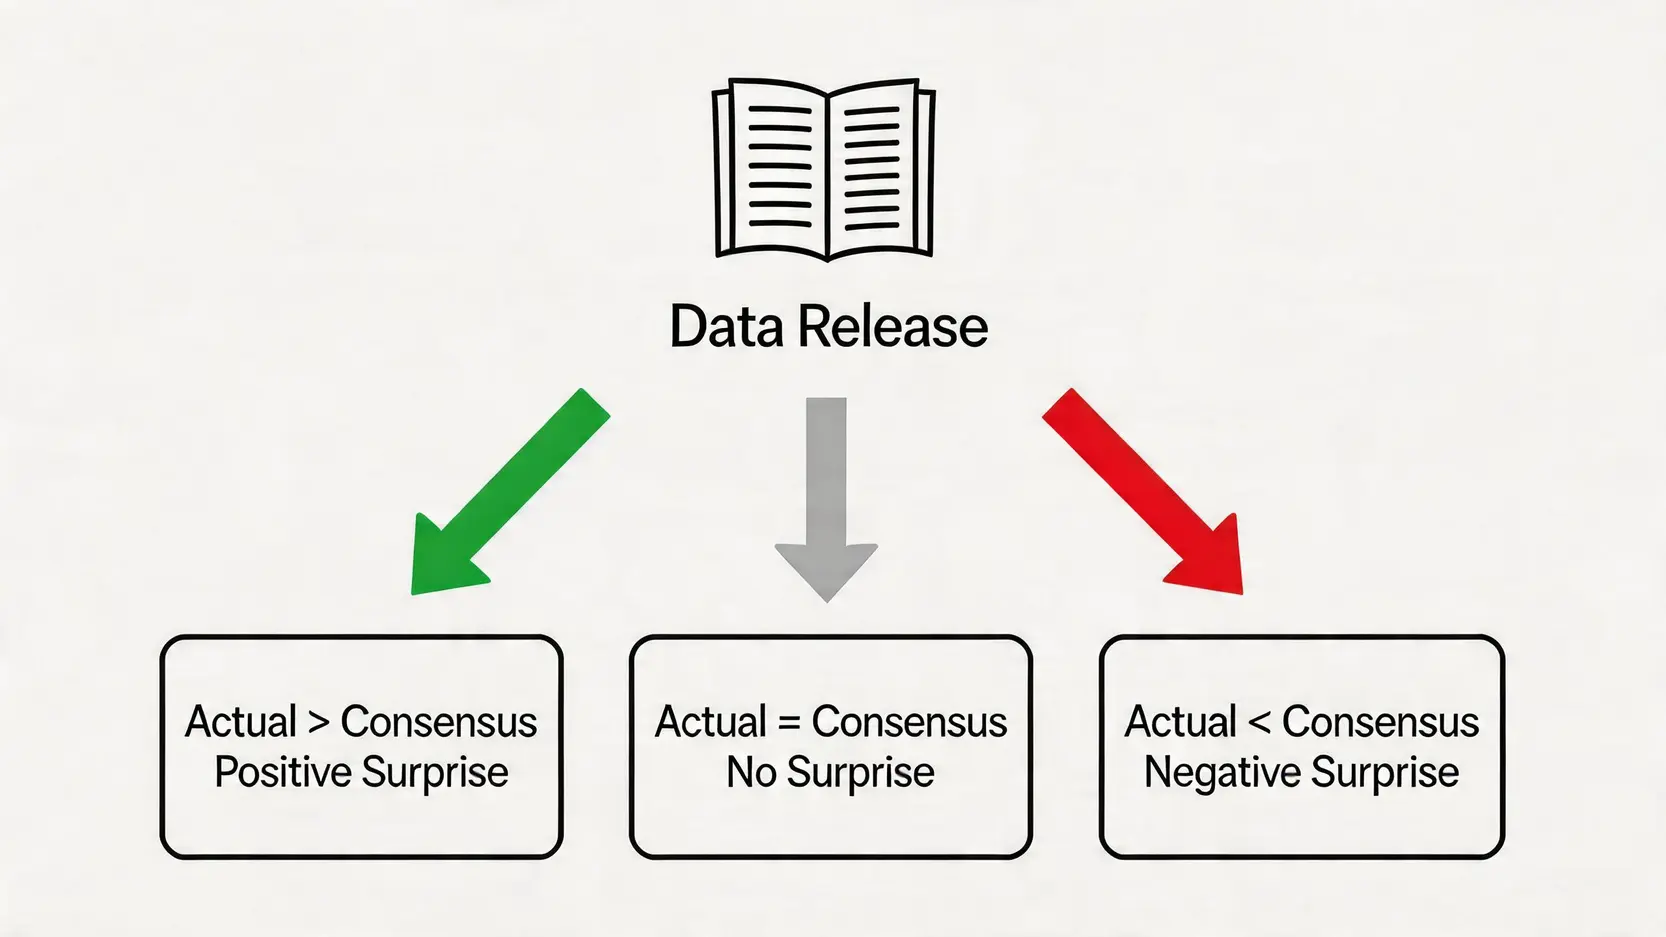
A: This is a very classic question, and the underlying reason is usually “buy the rumor, sell the fact”. The market may have already fully anticipated or even over-anticipated the positive outcome before the data release, and prices may have already risen significantly. When the data is finally confirmed, although it is positive, it does not deliver additional surprise. As a result, early buyers choose to take profits, leading to a price decline instead of a rise. This further reinforces the importance of the “surprise value”, rather than the data itself being good or bad.

Q: What should beginners pay attention to before trading economic data?

A: For beginners, trading data releases directly with a real trading account carries extremely high risk. Here are some key recommendations:

  • Practice with a demo account: First fully practice the above strategies on a demo account to become familiar with market reactions and order execution during data releases.
  • Control position size: In the early stage, use very small position sizes to keep potential losses within a manageable range.
  • Strict stop-loss discipline: Data-driven markets are highly volatile, and every trade must have a stop-loss order. This is the lifeline of your account.
  • Focus on major data: Do not attempt to trade all data releases. Initially focus only on high-impact events such as US Non-Farm Payrolls, CPI, and Federal Reserve interest rate decisions, and study their impact on specific currency pairs.


Conclusion

In summary, mastering the analysis of “economic data surprise value” is the foundation of developing effective “data release trading strategies”. Data trading is not gambling, but a probability-based game combined with risk management. By deeply understanding the role of market expectations and combining it with practical tactics such as breakout or straddle strategies, along with strict risk management discipline, you can remain calm during key data releases and make more informed “market expectation-based decisions”. Starting from the next major data release, try applying what you have learned today in live market observation, and you will find that market movements become much clearer.

If you liked this article, please share it!

Related Articles

  • Yen Futures Surge: Smart Money Positioning Guide
    Japanese Yen Futures Trading Volume Surges! Is Smart Money Flowing In? A Complete Guide to Positioning for the Opportunity Fundamentals: What Are Japanese Yen Futures? To understand the significance behind a surge in Japanese yen futures trading volume, we first need to answer a basic question: "What are Japanese yen...
    2026 年 6 月 5 日
  • Volatility Surface Guide: Skew Trading Strategies
    Practical Applications of Volatility Surfaces: From Options Modeling to Advanced Skew Trading Strategies In options markets, implied volatility is never a flat line. Instead, it forms complex "smile" or "skew" surfaces. For advanced traders, mastering the practical applications of volatility surfaces is equivalent to possessing a lens that reveals market...
    2026 年 6 月 3 日
  • Foreign Capital Flow Model: Track Institutional Money
    Building a Foreign Capital Flow Copy Trading Model: A Stock Market Indicator for Accurately Tracking Institutional Positioning In Asia-Pacific stock markets, foreign capital inflows and outflows often determine the direction of the index. However, simply looking at daily net buy and sell data is no longer enough. Only by building...
    2026 年 6 月 3 日
返回顶部