Long and Short Meaning Ultimate Guide: Understand How to Go Long and Short in Stocks and Master the Key to Profiting in the Market
You often hear financial news mentioning a “bull market” or saying that “bears are attacking”, but do you truly understand what they mean? Do you want to profit in the stock market but do not know how to go long or short in stocks? In fact, understanding the meaning of long positions and the explanation of bear markets is the first step for every investor to succeed. This article explains the core concepts of long and short in the most accessible way and provides clear practical guidance so that whether in a bull market or a bear market, you can take control and move steadily toward your investment goals.
What Are Long (Bull) and Short (Bear)? Essential Concepts to Understand Before Investing
Before entering the battlefield of the stock market, you must first understand the most basic terms: “long” and “short”. These two words do not only describe whether the market is rising or falling. They also represent two completely different market sentiments and investment strategies. The origin of their names is also quite vivid, making them easier to remember.
Long Meaning Explained: Why a Rising Market Is Called a “Bull Market”?
A “bull market” refers to a situation where the market generally expects asset prices to rise and investor sentiment is optimistic, leading investors to buy assets. It is called a “bull market” because when a bull attacks, it thrusts its horns upward from below. This action vividly represents the upward trend of rising stock prices.
In a bull market, the following characteristics usually appear:
Prices continue to rise: Major stock indices (such as the S&P 500 in the US and the Hang Seng Index in Hong Kong), show a long term upward trend.
Investor confidence is high: Market sentiment is optimistic. Most people believe they can make money by buying, and capital continues to flow into the market.
Economic data is strong: This is often accompanied by strong economic growth, low unemployment, and rising corporate profits.
Active trading volume: Investors are willing to trade, and the market maintains strong liquidity.
In simple terms, when most people are optimistic about the future market and believe stock prices will continue to rise, it is a typical bull market.
Short Meaning Explained: Why a Falling Market Is Called a “Bear Market”?
In contrast to the bull market, a “bear market”, refers to a situation where the market generally expects asset prices to fall and investor sentiment becomes pessimistic, leading investors to sell assets. The name comes from how a bear attacks, striking downward with its paws. This action metaphorically represents the continuous decline in stock prices.
The main characteristics of a bear market include:
Prices continue to fall: When major stock indices fall more than 20% from their peaks, it is usually defined as a technical bear market.
Investor confidence weakens: The market is filled with fear and pessimism, and investors tend to sell assets for protection.
Economic outlook deteriorates: It may be accompanied by negative developments such as economic recession, declining corporate earnings, and rising unemployment.
Shrinking trading volume or panic selling: The market lacks buying interest, or large scale selling occurs during panic, causing unstable trading volume.
When the market outlook becomes uncertain and most people believe stock prices will continue to decline, it is the dreaded short market, also known as a bear market.
Quick Comparison: Understand the Key Differences Between Bull and Bear Markets at a Glance
To help you distinguish between the two more clearly, the following table summarizes the core differences between bull and bear markets:
Illustration of Bull and Bear Markets: One charges upward while the other strikes downward, vividly explaining the long and short trends in the market.
Comparison Items
Bull Market
Bear Market
Market Trend
Continuous Upward Trend
Continuous Downward Trend
Investor Sentiment
Optimistic, Greedy, Highly Confident
Pessimistic, Fearful, Collapse of Confidence
Economic Background
Economic Growth, Strong Corporate Earnings
Economic Recession, Poor Corporate Earnings
Mainstream Strategy
Buy and Hold (Go Long)
Sell or Hold Cash (Go Short)
Metaphorical Animal
Bull (Upward Thrust)
Bear (Downward Strike)
How to Go Long and Short in Stocks? Practical Trading Strategy Guide
After understanding the meaning of long and short, the next and most important step is practical execution: how should we operate under different market conditions? This involves two core strategies: “going long” and “going short”.
“Go Long” Strategy: How to Capture Upward Trends for Profit
“Going long” is the investment approach you are most familiar with, and its logic is very simple and direct: buy low and sell high. When you expect the price of a stock or asset to rise, you buy it first and then sell it after the price reaches your target level, earning the difference in between. This is the most mainstream strategy in a bull market and also the most suitable for beginners.
Method of operation: Buy stocks, ETFs, or other financial assets directly through a securities account.
Profit method: Capital appreciation resulting from rising asset prices.
Risk: Limited risk. The maximum loss is the entire principal you invested (that is, if the stock price falls to 0).
Applicable scenario: Mainly used when you believe the market or a specific stock is in an upward trend.
For most investors, focusing on identifying quality companies during a bull market and “going long” is one of the most stable ways to accumulate wealth. If you want to learn how to get started, you can refer to this stock investing basics guide, which provides detailed step by step instructions.
“Go Short” Strategy: How to Profit in a Bear Market? Steps and Risk Analysis
“Going short” is a relatively complex strategy with higher risk. Its core logic is the exact opposite of going long: sell high and buy low. When you strongly expect the price of an asset to decline, you can profit through short selling. This is also why some experienced investors can still make money during bear markets.
The standard steps of short selling are as follows:
Borrow shares: First, borrow the shares you want to short from your broker.
Sell shares: Immediately sell the borrowed shares in the market at the current market price.
Wait for the decline: Wait for the stock price to fall as you expected.
Buy back shares: After the price drops to your target level, buy back the same number of shares from the market.
Return shares: Return the repurchased shares to the broker and the trade is completed.
Short Selling Process Explained: Through five steps of “sell high and buy low”, profits can also be generated in a bear market.
Your profit is the difference between the price at which you initially sold the shares and the price at which you later bought them back (after deducting interest and transaction fees).
Important Note: Short selling carries extremely high risk!
The maximum loss when going long is 100% of your invested principal, but the loss from short selling is theoretically unlimited. This is because the maximum decline of a stock price is to 0, but its rise has no ceiling. If the stock you shorted rises instead of falling, you must buy it back at a higher price to return it to the broker. The higher the price rises, the greater your loss becomes. Therefore, short selling is considered an advanced strategy and requires a very high level of judgment and risk control from investors.
Should I Go Long or Go Short? 3 Practical Indicators for Determining Market Trends
Before deciding whether to go long or short, the most critical step is determining the current market trend. Although no one can predict the future with 100% certainty, the following widely used indicators can help improve the accuracy of your judgment:
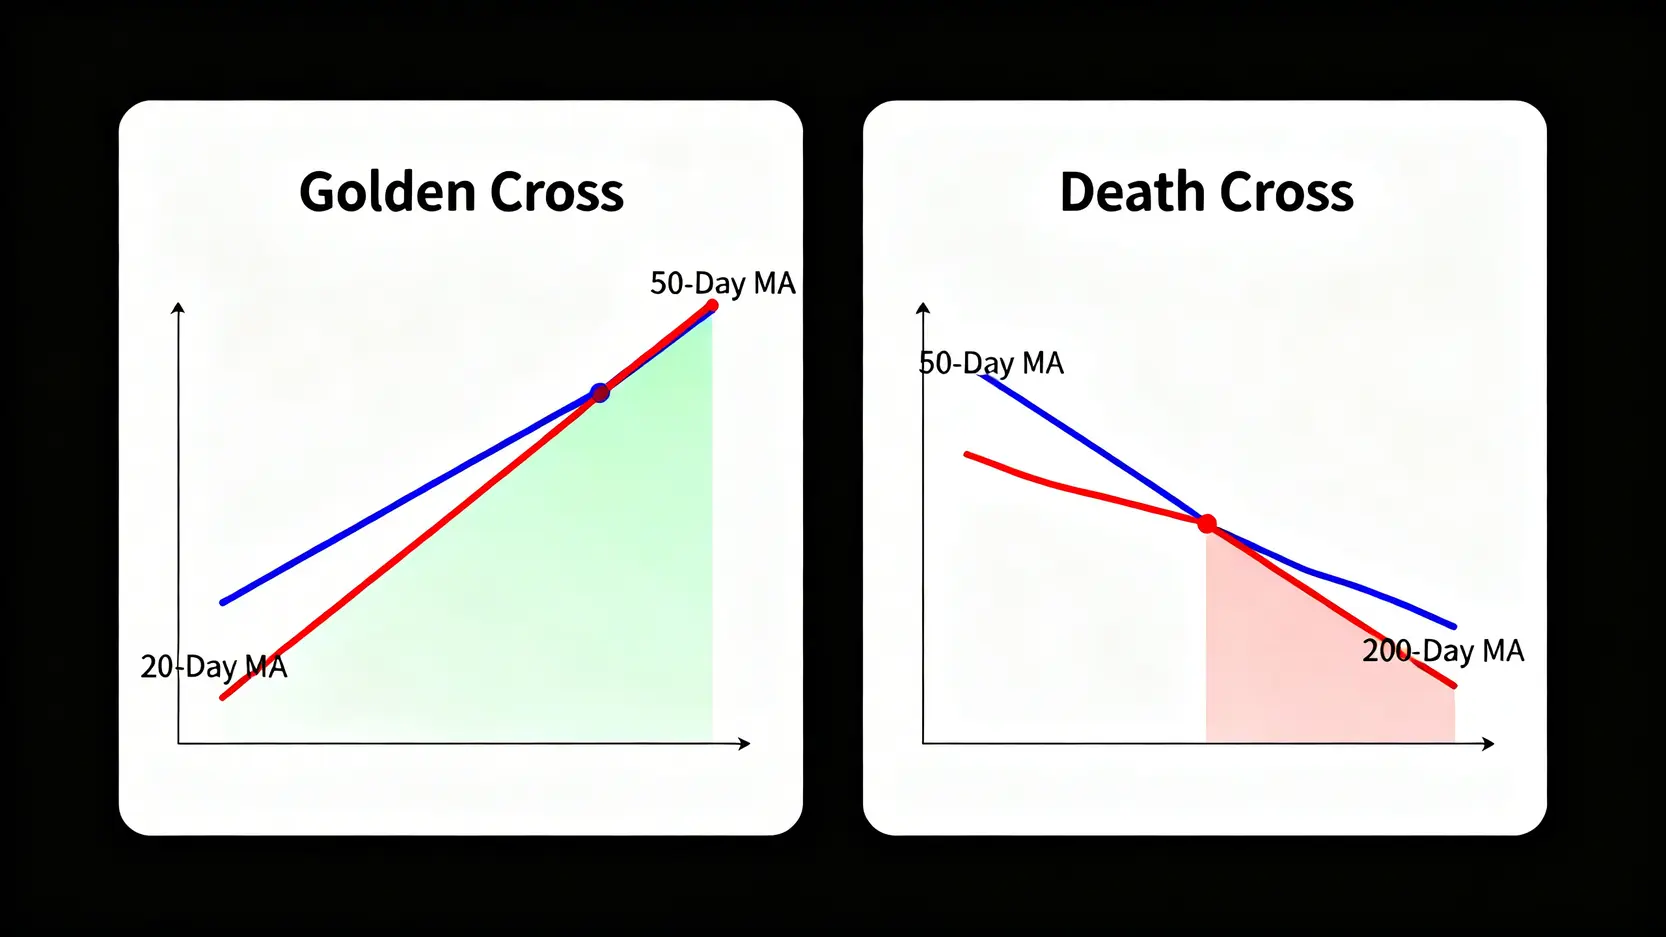
Moving Average (MA): This is one of the most basic technical indicators. When a short term moving average (such as the 50 day line) crosses above a long term moving average (such as the 200 day line), forming a “Golden Cross”, it is usually considered a bullish signal. Conversely, when the short term moving average crosses below the long term moving average, forming a “Death Cross”, it is considered a bearish signal.
Technical Indicator Basics: Understand the Golden Cross (buy signal) and Death Cross (sell signal).
Performance of major market indices: Pay attention to indices such as the S&P 500 Index and Nasdaq Index in the US, or the Hang Seng Index and Taiwan Weighted Index locally. These indices are the “thermometer” of the market. If indices continue to reach new highs, it indicates a strong bullish trend. Conversely, if they fall more than 20% from their peaks, the market enters a technical bear market.
Volatility Index (VIX): The VIX reflects the market’s expectation of volatility over the next 30 days. When the VIX remains at a low level, it indicates stable market sentiment and is favorable for bullish markets. When the VIX surges, it reflects rising market panic and is usually a characteristic of a bear market.
Using these indicators together can help you analyze more objectively whether the market is currently bullish or bearish, allowing you to formulate a more appropriate investment strategy.
Common Questions (FAQ)
Q: Does a bull market mean that all stocks will rise?
A: Not necessarily. Although in a bull market most stocks tend to rise along with the broader market, often described as “a rising tide lifts all boats”, this does not apply to every stock. Companies with weak fundamentals, poor industry outlooks, or negative news may still see their share prices decline even during a bull market. Therefore, stock selection remains very important even in a bull market.
Q: Is the risk of short selling stocks higher than going long?
A: Yes, it is much higher than going long. The maximum risk when going long (which means buying stocks) is losing the entire invested principal. If the stock price falls to 0, the loss is 100%. However, the potential loss from short selling (shorting stocks) is unlimited because there is no upper limit to how high a stock price can rise. If a stock rises from $10 to $100, the loss for a short seller would be 900%. This is why short selling requires extremely strict risk management.
Q: Is short selling suitable for beginners? What should they be aware of?
A: Short selling is generally not recommended for beginners. It requires accurate market judgment, strict stop loss discipline, and strong psychological resilience. Beginners should first focus on learning fundamental analysis, value investing, and long strategies. Only after accumulating sufficient experience and knowledge should they consider attempting short selling. If they decide to try it, they must use a small amount of capital and set clear stop loss levels.
Q: What is the origin of the names bull market and bear market?
A: There are several explanations for the origin of these terms, but the most widely known comes from the attacking posture of the animals. When a bull attacks, it thrusts its horns upward from below, symbolizing rising stock prices, which is why it is called a “bull market”. When a bear attacks, it strikes downward with its paws, symbolizing falling stock prices, which is why it is called a “bear market”. This vivid analogy helps investors quickly understand market direction.
Conclusion
In summary, understanding the meaning of long positions and the explanation of bear markets, and learning how to go long and short in stocks, are essential fundamentals for every stock investor. In a bull market, investors should seize opportunities and follow the trend. In a bear market, greater caution is required, and short selling tools can sometimes be used to find opportunities during declines. Regardless of how the market changes, mastering the right knowledge and risk management techniques is the key to navigating the investment landscape steadily. Apply these concepts to your analysis and build a solid foundation for your investment portfolio.
How to Get Started with Bitcoin? The Complete 2026 Bitcoin Buying Guide for Beginners After watching Bitcoin repeatedly reach new highs in recent years and successfully pass spot ETF reviews in the US and Hong Kong in 2024, officially entering mainstream financial markets, many investors have turned their attention to...
Is Gold’s V-Shaped Rebound a Bottom-Fishing Signal? A Complete Guide to Trading Strategies Amid “$100 Price Swings” What Is a Gold V-Shaped Rebound? More Than Just a Technical Pattern The gold market has recently experienced sharp rises and falls, with prices frequently displaying dramatic “gold V-shaped rebounds”. Single-day “$100 price...
What Is PPI Data? 2026 Latest Analysis: Understand the Differences from CPI and How It Affects Stock Market Trends With market information constantly changing, do you always hold your breath while waiting for CPI data to be released? But did you know that a more forward-looking inflation indicator, PPI data...