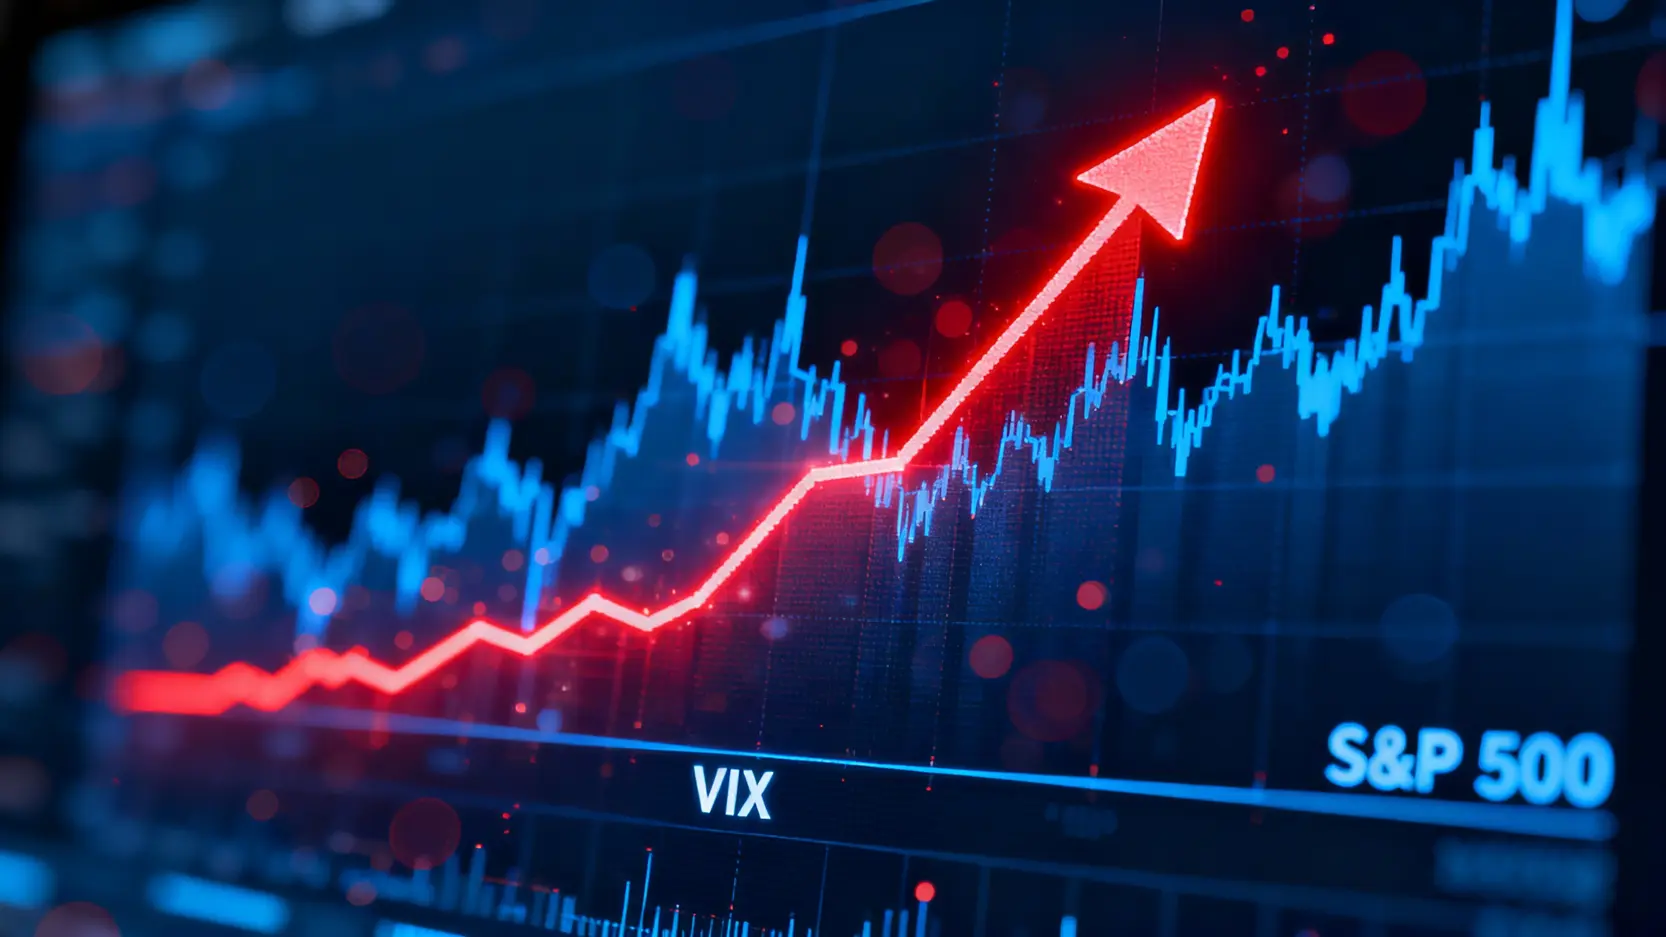
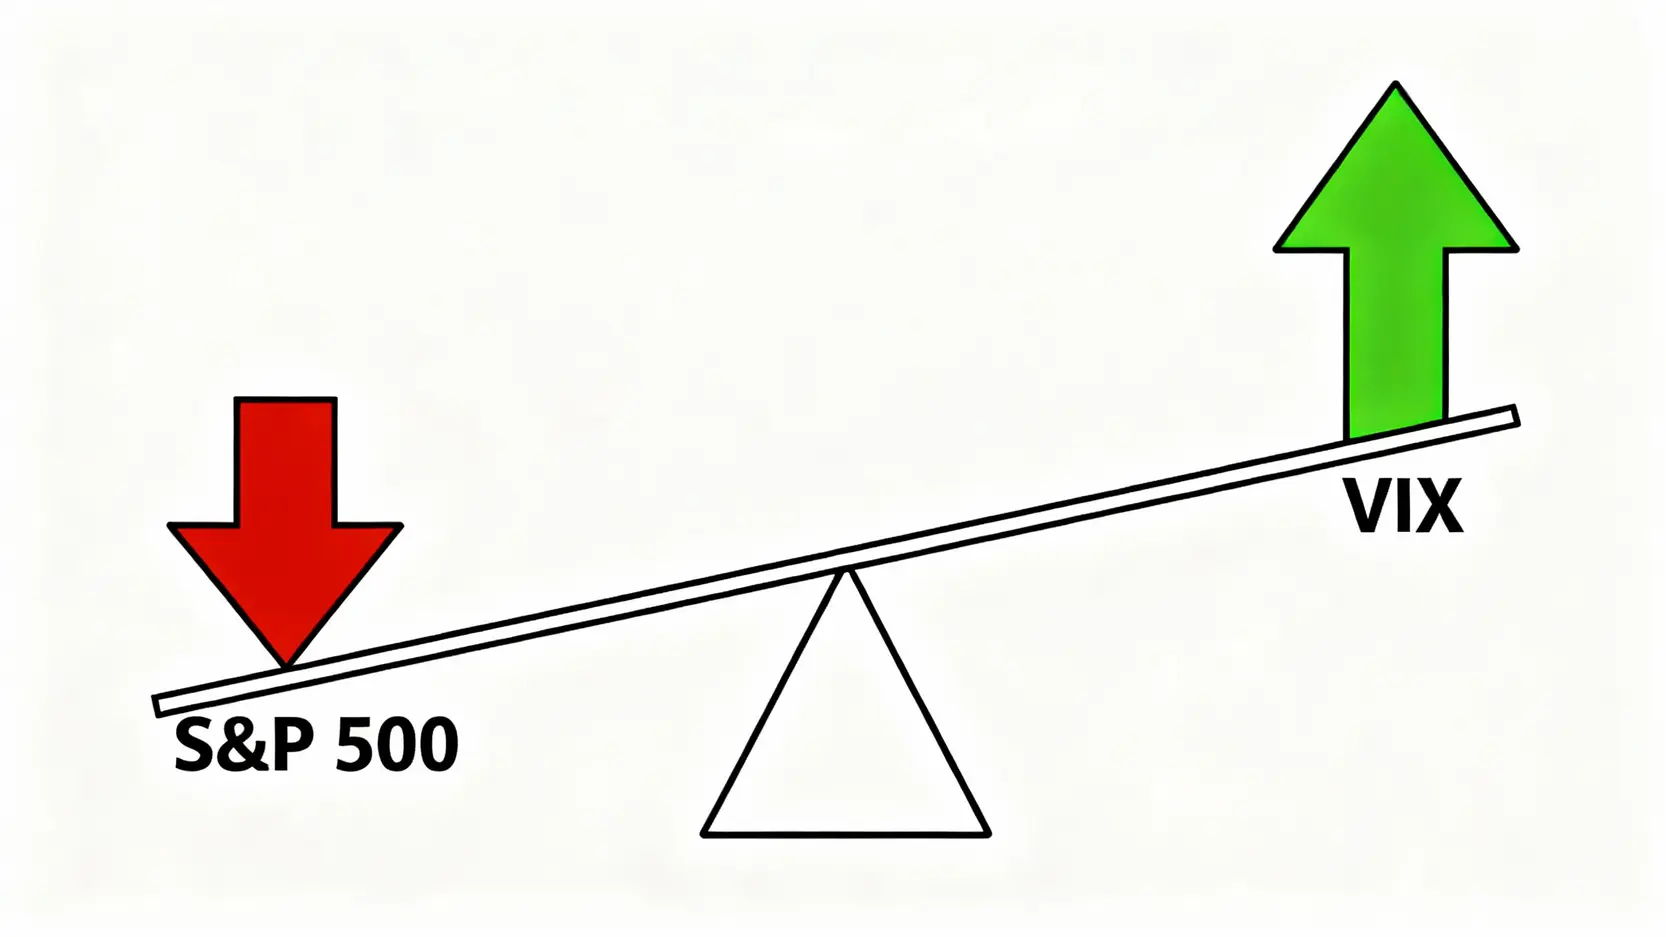
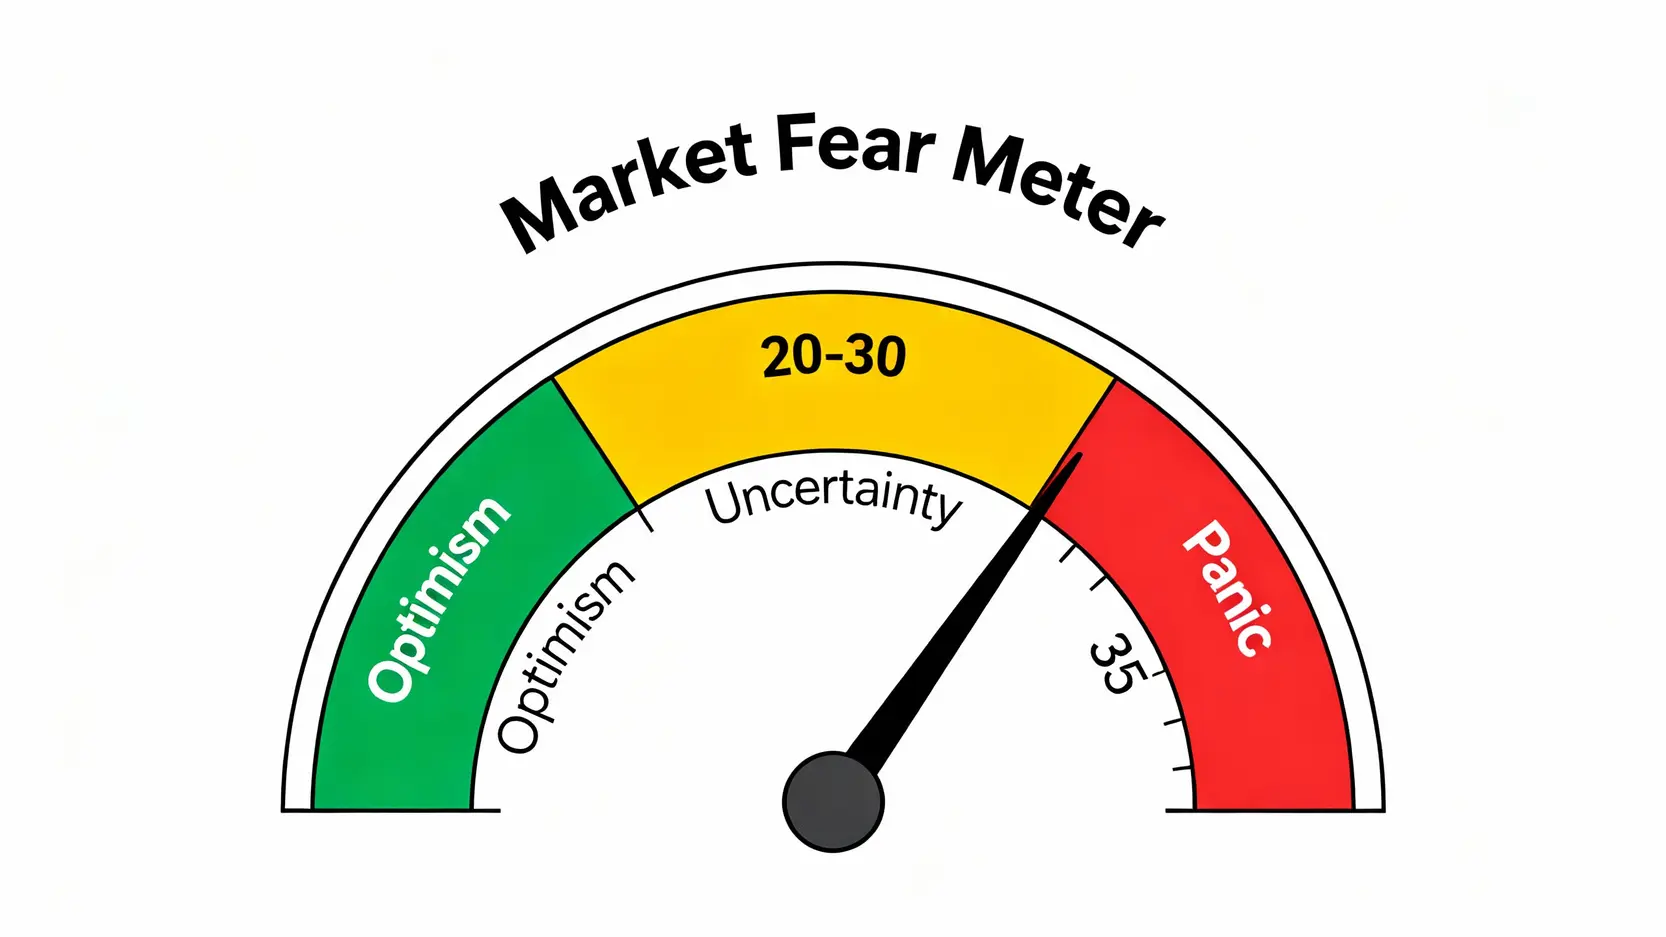
VIX Real-Time Quotes 2026: 5 Free Platforms & Strategy

VIX Index Real-Time Quotes: Five Free Platforms to View? Fear Index Investment Strategy Tutorial
With recent increases in volatility across the US equity market, do you often feel uneasy and want to understand the market’s “level of panic”? Known as the “fear index”, real-time data for the US VIX Index is a key indicator for measuring market sentiment. However, many investors face the same questions: “Where can I check the VIX Index?” and “How can I access the most up-to-date VIX quotes?”. This article provides an ultimate guide that explains the meaning of the VIX Index in detail and recommends five of the best platforms, allowing you to easily track real-time US VIX Index data and make more informed investment decisions.
What Is the VIX Index? Understanding the Meaning Behind the “Fear Index”
Before exploring where to check the VIX Index, it is essential to understand what this indicator truly represents. The VIX Index, formally known as the “Chicago Board Options Exchange Volatility Index” (CBOE Volatility Index), does not directly track the price of any stock. Instead, it reflects market expectations of volatility in the S&P 500 Index over the next 30 days.
The Definition of the VIX Index: Why Does It Reflect Market Fear?
The VIX Index is referred to as the “fear index” or “panic indicator” because it typically shows a “negative correlation” with stock market movements. Imagine a scenario where the market outlook becomes uncertain, such as signs of an economic recession or major geopolitical conflicts. Investors tend to feel anxious. To hedge their equity holdings, they aggressively purchase put options on the S&P 500 Index for protection. This surge in hedging demand drives option prices higher, which in turn causes the VIX Index to spike. Conversely, when markets are stable and investor confidence is strong, hedging demand declines and the VIX Index remains at lower levels. As such, the level of the VIX Index acts like a mirror, reflecting the overall fear and greed prevailing on Wall Street.
How Is the VIX Index Calculated? An Analysis of Its Relationship With the S&P 500 Index
The calculation of the VIX Index is relatively complex. It is primarily derived from a weighted average of near-term and next-term option prices across a range of different strike prices on the S&P 500 Index. In simple terms, it captures the prices market participants are willing to pay to buy or sell S&P 500 Index options, and from this infers the implied volatility over the next month. The official calculation methodology is established and published by the Chicago Board Options Exchange (CBOE).
The most classic relationship between the VIX Index and the S&P 500 Index is the “seesaw effect”:

- When the S&P 500 Index falls, market fear intensifies, investors seek hedging, and the VIX Index usually rises.
- When the S&P 500 Index rises, market sentiment turns optimistic, expected volatility declines, and the VIX Index usually falls.
It is precisely this strong negative correlation that makes the VIX Index an important reference tool for identifying potential market turning points.
Interpreting VIX Index Quotes: What Do Different Levels Signal About the Market?
To make effective use of VIX Index quotes, the first step is to understand the signals behind its values. Generally, the VIX Index can be interpreted by dividing its levels into the following ranges:

| VIX Index Range | Market Sentiment Interpretation | Potential Market Conditions |
| Below 20 | Market sentiment is stable and optimistic | This typically corresponds to a bull market or a period of market consolidation. Investors have a higher risk appetite, but extremely low levels, (such as below 12) may indicate excessive market complacency and warrant caution for potential reversal risks. |
| 20 – 30 | Market concerns emerge and uncertainty increases | The market may face a short-term pullback or heightened volatility. Investors begin to feel uneasy, and demand for hedging gradually increases. |
| Above 30 | Market is in panic and extreme fear | This usually occurs during bear markets, market crashes, or major negative events. It indicates that the market expects significant volatility ahead, but it may also signal that panic selling is nearing an end, making it a point of interest for contrarian investors. |
Further Reading (Highly Recommended)
Where to Check the VIX Index? Five Best Real-Time Quote Platforms Recommended
After understanding the importance of the VIX Index, the next key question naturally becomes: “Where can I check the VIX Index?”. Fortunately, there are now many free and powerful platforms that provide real-time US VIX Index data. Below are five of the best curated choices:
1. Google Finance: The Most Intuitive Free Charting Tool
For investors who value simplicity and speed, Google Finance is an excellent starting point for checking VIX Index quotes. Simply enter “VIX” in the search bar to access real-time quotes, clear historical price charts, and related news. Its interface is clean and ad-free, making it ideal for quick daily checks.
2. Yahoo Finance: A Comprehensive Financial Information Website
Yahoo Finance is a long-established and feature-rich financial website. In addition to real-time VIX quotes and interactive charts, it offers detailed historical data, options chain information, and comparison tools for related indexes. If you want deeper analysis, Yahoo Finance provides richer data dimensions than Google Finance.
3. Futu (Futubull): Real-Time Quotes in a Broker App Commonly Used by Hong Kong Investors
As a broker app that Hong Kong investors are very familiar with, Futubull includes built-in real-time quotes for the VIX Index. Its advantage is that you can trade US stocks and monitor VIX Index movements within the same app, without switching platforms. Futu’s charting features and technical indicators are also quite comprehensive, making it convenient for real-time strategy analysis.
4. Moomoo: A Trading Platform Offering Detailed Technical Analysis
Moomoo, the international version of Futu, also provides robust VIX Index quotes and charting tools. It is known for professional-grade chart analysis features and an active investor community. On Moomoo, you can apply dozens of technical indicators to analyze VIX trends and exchange views with other investors, making it suitable for users with higher technical analysis requirements.
5. TradingView: Professional-Grade Charting Analysis and Community Discussion
TradingView is one of the world’s most popular charting platforms and is often regarded as the “Swiss Army knife” of chart analysis. It offers powerful and highly customizable VIX charts. Users can draw trendlines, use a vast library of indicators, and even write their own analysis scripts. In addition, its large community includes many professional traders who share analyses of VIX movements, making it an excellent platform for learning and discussion.
How to Use the VIX Index for Investment Decisions?
Simply knowing VIX Index quotes is not enough. The key is learning how to apply it to support investment decisions. The VIX Index is not a buy or sell signal, but rather a “thermometer” that measures market sentiment and risk.
VIX as a Contrarian Indicator: When to Be Greedy When Others Are Fearful?
Warren Buffett’s famous quote, “Be greedy when others are fearful, and fearful when others are greedy”, perfectly captures the essence of using the VIX Index as a contrarian indicator.
- When the VIX surges to extreme highs (such as above 40), it means the market has fallen into extreme panic, and many investors are dumping stocks regardless of price. For prepared long-term investors, this is often a golden opportunity to buy quality assets in batches, because the “peak of panic” frequently corresponds to the “market bottom”.
- When the VIX falls to extreme lows (such as below 12), it indicates extreme optimism, with almost no one expecting a decline and risk awareness dropping to a minimum. Such moments of “excessive greed” may instead serve as a warning light that a market pullback is approaching, reminding investors to reduce exposure appropriately or strengthen risk management.
Overview of Related VIX ETF Products and Key Risk Considerations (e.g., VXX, UVXY)
Some investors want to profit directly from VIX fluctuations, so the market has introduced ETFs, exchange-traded funds, or ETNs, exchange-traded notes, that track VIX futures indexes, such as the ProShares Ultra VIX Short-Term Futures ETF (UVXY) and the iPath Series B S&P 500 VIX Short-Term Futures ETN (VXX).
Major Risk Warning: It must be emphasized that these VIX ETFs are absolutely not suitable for ordinary investors, especially for long-term holding. They have the following critical flaws:

- Futures roll cost (contango bleed): VIX ETFs operate by trading VIX futures. In most market conditions, longer-dated futures are more expensive than near-dated futures, known as contango. When the ETF rolls its contracts, it effectively “buys high and sells low”, causing its net asset value to erode over time.
- No compounding effect: These products are complex by design and do not have the long-term growth potential of equities. Their value tends to drift toward zero over the long run.
- Leverage risk: Leveraged ETFs such as UVXY can be extremely volatile and carry very high risk, potentially resulting in substantial losses in a short period.
In short, VIX ETFs are tools used by professional traders for short-term hedging or speculation, not investment vehicles. For most investors, it is more appropriate to treat the VIX Index as a market observation indicator rather than something to trade directly. A thorough understanding of these risks is essential. You may refer to the case analysis in 【ETF Arbitrage Tutorial】2025 Latest Guide: Learn ETF Premium and Discount Arbitrage in 3 Steps, Understanding Risks Through the Fubon VIX Case.
Further Reading (Highly Recommended)
Frequently Asked Questions About the US VIX Index (FAQ)
Q: Does a higher VIX Index mean greater danger?
A: Not entirely. A high VIX Index indicates that the market “expects” very sharp volatility over the next 30 days, which does mean that investment risk is increasing. However, from a contrarian investment perspective, extremely high VIX levels (reflecting extreme market panic) may also suggest that selling pressure is nearing its end and potential investment opportunities could be emerging. It is both a risk indicator and an opportunity indicator.
Q: Can retail investors directly buy or sell the VIX Index?
A: No. The VIX is a calculated index and cannot be directly traded like a stock. Investors can only trade derivative financial products linked to it, such as VIX futures, VIX options, or the VIX-related ETFs or ETNs mentioned earlier. These instruments are highly complex and carry very high risk, making them unsuitable for beginner investors.
Q: Besides the US VIX, does Hong Kong have its own fear index?
A: Yes. Hong Kong’s fear index is the “Hang Seng Volatility Index” (VHSI). Its calculation methodology is similar to that of the US VIX Index, but it tracks the expected volatility of the Hang Seng Index and is primarily used to measure market sentiment and risk in the Hong Kong equity market.
Q: Does a low VIX Index mean it is safe to enter the market?
A: Not necessarily. While a persistently low VIX Index reflects market stability, it may also foster excessive optimism and complacency. When everyone believes the market will not fall, it is often at its most vulnerable point. Therefore, extremely low VIX levels should also be viewed as a warning signal, reminding investors to maintain risk awareness rather than blindly chasing prices higher.
Q: What is the unit of VIX Index quotes?
A: The VIX Index is quoted in percentage terms (%). For example, when the VIX reads 20, it means the market expects the S&P 500 Index to have an annualized volatility of 20% over the next 30 days. You can think of it as a relative measure of expected volatility magnitude.
Conclusion
In summary, learning to monitor real-time US VIX Index data is an essential skill for every US equity investor seeking to protect assets in volatile market conditions. Through the five platforms recommended in this article, you now clearly know “where to check the VIX Index” and how to obtain real-time quotes. It is hoped that you can make effective use of the VIX as a powerful market sentiment indicator, allowing you to respond calmly to changing market conditions and identify optimal investment opportunities. Choose a suitable platform now and start tracking VIX Index quotes!
Related Articles
-
Practical Applications of Volatility Surfaces: From Options Modeling to Advanced Skew Trading Strategies In options markets, implied volatility is never a flat line. Instead, it forms complex "smile" or "skew" surfaces. For advanced traders, mastering the practical applications of volatility surfaces is equivalent to possessing a lens that reveals market...2026 年 6 月 3 日
-
Building a Foreign Capital Flow Copy Trading Model: A Stock Market Indicator for Accurately Tracking Institutional Positioning In Asia-Pacific stock markets, foreign capital inflows and outflows often determine the direction of the index. However, simply looking at daily net buy and sell data is no longer enough. Only by building...2026 年 6 月 3 日
-
Options Buyer Strategies During Extreme Market Conditions: Black Swan Hedging and Cross-Market Arbitrage During Volatility Surges The most terrifying aspect of financial markets is not a gradual decline, but overnight flash crashes and cross-market capital withdrawals accompanied by volatility surges. In the highly unpredictable global macroeconomic environment of 2026, geopolitical...2026 年 6 月 3 日


