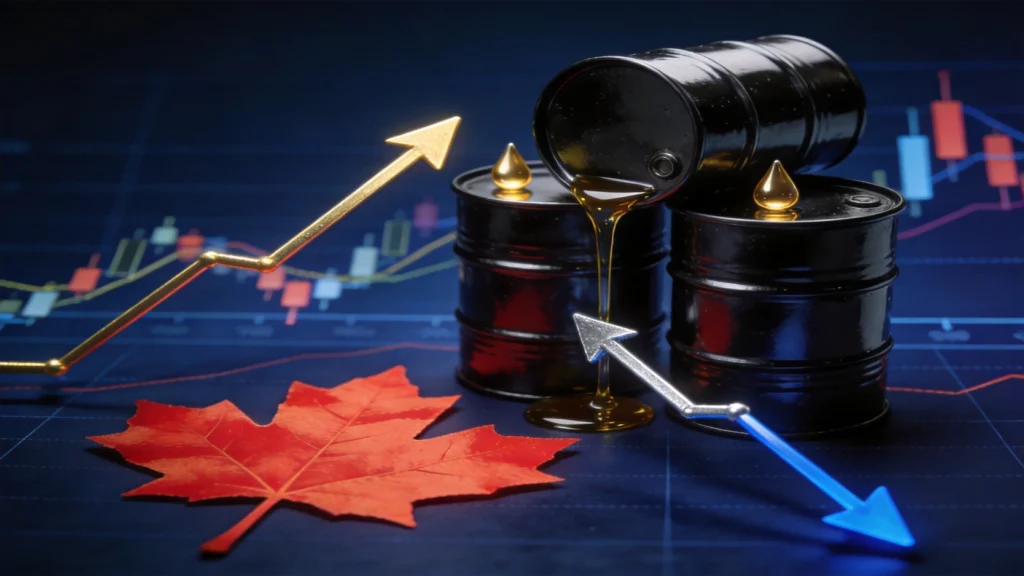
Oil Rises, Gold Rises Too? Understanding the Co-Movement and Divergence Between Gold and Crude Oil in 2026
The saying “oil rises, gold rises” is often heard in the market, as though gold prices will always move whenever oil prices do. However, experienced investors know that reality is far more complex. Sometimes, oil prices surge while gold prices remain unusually calm or even fall in the opposite direction. What market logic lies behind this? This article will provide an in-depth analysis of the intricate relationship between gold and crude oil, from the traditional positive correlation between gold and crude oil prices to the unusual divergences seen in recent markets. It will also show you how to use the key indicator known as the “gold-to-oil ratio” to find your investment compass amid the ever-changing pulse of the global economy.
The Traditional Relationship Between Oil and Gold Prices: Why Do They Usually “Rise and Fall Together”?
Gold and crude oil, two seemingly unrelated commodities, often display remarkable synchronization in financial markets. This tendency to “rise and fall together” mainly stems from their shared responses to macroeconomic factors, particularly the two major forces of inflation and the US Dollar Index.
Inflation as a Common Driver: How Do Rising Oil Prices Push Up Gold Prices?
Crude oil is known as the “lifeblood of industry”, and its price fluctuations directly affect the cost structure of the global economy. What happens when oil prices rise?
- Transportation costs increase: From freight transportation to aviation, all transportation costs rise.
- Production costs increase: Many industrial products, from plastics to chemicals, rely on oil as a raw material or energy source, causing costs to rise accordingly.
- Pressure on household consumption: Electricity bills, gas bills, and the prices of everyday goods are all affected, further pushing up the overall Consumer Price Index (CPI).
Inflation expectations caused by rising oil prices erode the purchasing power of fiat currencies (such as the US dollar and the euro). Under these circumstances, gold’s role as a precious metal with stable intrinsic value and limited supply highlights its “store of value” and inflation-hedging properties. Capital flows into the gold market to avoid the risk of currency depreciation, pushing up gold prices and creating the classic “oil rises, gold rises” scenario.
The Seesaw Effect of the US Dollar Index: Understanding the Three-Way Relationship Between the US Dollar, Oil, and Gold
In international markets, both gold and crude oil are priced in US dollars. This creates an interesting “seesaw” relationship. You can refer to the Taiwan Petroleum Workers’ Union’s analysis of the relationship between oil, the US dollar, and gold for a deeper understanding of their complex interaction.
- When the US dollar depreciates: When the US dollar weakens, more US dollars are required to purchase the same amount of gold or the same barrel of crude oil, naturally causing US dollar-denominated gold and oil prices to rise.
- When the US dollar appreciates: Conversely, when the US dollar strengthens, gold and oil become more expensive for investors in other countries (such as those using the euro or Japanese yen). Demand may therefore decline, placing pressure on prices.
Therefore, when certain market factors (such as monetary easing by the US Federal Reserve), weaken the US dollar, both oil and gold prices are often pushed higher. This is another major reason behind the “oil rises, gold rises” phenomenon.
Further Reading, Highly Recommended
Comparison of the Advantages, Disadvantages, and Costs of Five Channels: Physical Gold, Gold Passbooks, ETFs, and Futures
Beginner’s Guide to Gold Investment: A Complete Analysis of the Advantages and Disadvantages of Five Channels, Including Investment Benefits and Risks
Why Does the Unusual Phenomenon of “Oil Rises, Gold Falls” Occur?
Since oil and gold prices share such a close positive correlation, why do divergent trends such as “oil rises, gold falls” or even “oil falls, gold rises” still occur? This usually happens under specific macroeconomic conditions. When certain factors become more influential than inflation and the US dollar, the relationship between the two temporarily decouples.
Shifting Safe-Haven Sentiment: Market Panic and the US Dollar’s Safe-Haven Effect Under Geopolitical Risk
Gold is widely recognized as a safe-haven asset, but the US dollar also serves as a “safe haven” under extreme circumstances. When a severe global financial crisis or geopolitical conflict erupts, market reactions may diverge:
- General risk aversion: If a regional conflict or economic disruption occurs, capital flows out of risk assets such as stocks while moving into gold and the US dollar for safety.
- Extreme panic (Flight to Safety): When a crisis expands to the point where it may affect the global financial system (such as during the 2008 global financial crisis), investors may sell all assets at any cost (including gold, stocks, and even other currencies), simply to obtain the most liquid form of US dollar cash. During these “Cash is King” moments, the US dollar’s safe-haven status is magnified dramatically, causing the US Dollar Index to surge and placing intense pressure on US dollar-denominated gold and crude oil. Even if oil prices rise because of concerns over supply disruptions, gold prices may fall because of the strong US dollar, creating an “oil rises, gold falls” scenario.
Recession Concerns Overwhelm Inflation Expectations: When High Oil Prices Become an Economic Killer
Higher oil prices are not always beneficial. When oil prices surge to levels that the market cannot withstand within a short period, they no longer merely drive inflation. They become a “killer” that suppresses economic growth.
Excessively high oil prices can severely squeeze corporate profits and household purchasing power, causing economic activity to slow or even enter a recession. Under these circumstances, the market’s main concern shifts from “fighting inflation” to “fearing recession”.
This sentiment leads to:
– Lower expectations for crude oil demand: The market expects future energy demand from factory production and transportation to decline, suppressing further increases in oil prices or even causing them to retreat from high levels.
– A complex response from gold: On the one hand, recession concerns increase safe-haven demand for gold. On the other hand, if the market simultaneously expects central banks to adopt more aggressive monetary tightening to combat oil-driven inflation (even if this increases recession risks), the high-interest-rate environment raises the opportunity cost of holding gold and places pressure on gold prices. Under this complex mix of bullish and bearish forces, oil prices may remain volatile at high levels or decline, while gold prices also fall because of a strong US dollar or interest rate hike expectations, creating an “oil rises, gold falls” divergence.
Investment Compass: How Can the “Gold-to-Oil Ratio” Be Used to Assess Market Trends?
To find direction amid the co-movement and divergence of oil and gold prices, professional investors refer to a highly useful indicator known as the “gold-to-oil ratio”. This ratio acts like a market sentiment detector, helping us determine whether gold or crude oil is overvalued or undervalued.
What Is the Gold-to-Oil Ratio? How Does It Measure the Relative Value of Gold and Oil?
The gold-to-oil ratio is calculated very simply:
Gold-to-Oil Ratio = Price of Gold per Ounce / Price of Crude Oil per Barrel
This figure represents “how many barrels of crude oil can be purchased with one ounce of gold”. It measures the relative value of gold and crude oil. When the gold-to-oil ratio rises, gold becomes more expensive relative to crude oil. Conversely, when the ratio falls, crude oil becomes more expensive relative to gold.
What Does an Excessively High or Low Gold-to-Oil Ratio Mean? (With Historical Data and Chart Analysis)
Historical data show that the gold-to-oil ratio fluctuates within a long-term range and tends to return to its historical average, approximately 15-20. Extreme ratios usually indicate specific market conditions and potential investment opportunities. You can refer to the gold-to-oil ratio chart provided by MacroMicro to observe its historical changes.
- An excessively high gold-to-oil ratio (such as above 25-30):
This usually means that the market is experiencing intense risk aversion or an economic recession. At such times, safe-haven demand for gold increases sharply, pushing up prices, while a weak economic outlook reduces crude oil demand and keeps oil prices low. This may indicate:
– Gold is “overbought” (or excessively expensive), relative to crude oil.
– Crude oil is “oversold” (or excessively cheap), relative to gold.
- An excessively low gold-to-oil ratio (such as below 10-15):
This often occurs during periods of strong and prosperous global economic growth. Strong industrial and transportation demand pushes up oil prices, while higher market risk appetite reduces safe-haven demand for gold. This may indicate:
– Crude oil is “overbought” relative to gold.
– Gold is “oversold” relative to crude oil.
Practical Guide: How to Use the Gold-to-Oil Ratio to Develop Gold or Crude Oil Trading Strategies
Based on the theory of “mean reversion”, investors can use extreme gold-to-oil ratio levels to develop “pairs trading” or directional strategies. Please note that this is only an analytical tool and is by no means a guaranteed trading formula.
- When the gold-to-oil ratio is at a historical high:
– Strategy: Short gold while going long crude oil.
– Logic: Bet that market panic will ease or that the economy will bottom out and recover. This would cause gold prices to fall and oil prices to rise, bringing the gold-to-oil ratio back toward normal levels.
- When the gold-to-oil ratio is at a historical low:
– Strategy: Go long gold while shorting crude oil.
– Logic: Bet that an overheating economy may cause inflation to spiral out of control or growth to peak. This would increase gold’s safe-haven value, while excessively high oil prices may suppress demand, causing the gold-to-oil ratio to rise.
Important Reminder: The gold-to-oil ratio is a macroeconomic indicator that reflects long-term trends. It is not suitable for short-term trading and must be assessed together with current global geopolitical conditions, central bank monetary policies (particularly the Federal Reserve’s actions) and global economic data to improve decision-making accuracy.
Further Reading (Highly Recommended)
Comparison of the Advantages, Disadvantages, and Costs of Five Channels: Physical Gold, Gold Passbooks, ETFs, and Futures
Beginner’s Guide to Gold Investment: A Complete Analysis of the Advantages and Disadvantages of Five Channels, Including Investment Benefits and Risks
Frequently Asked Questions (FAQ)
Q: If oil prices rise, will gold prices definitely rise as well?
A: Not necessarily. Although rising oil prices usually trigger inflation concerns and push up gold prices, creating the positive correlation known as “oil rises, gold rises”, divergences such as “oil rises, gold falls” may occur under extreme market conditions. Examples include tightening US dollar liquidity caused by a global financial crisis, or recession fears outweighing inflation expectations.
Q: What are the biggest common factors affecting oil and gold prices?
A: The US Dollar Index and global inflation expectations are the two main common factors affecting both. Since gold and crude oil are both priced in US dollars, the strength of the US dollar directly affects their prices (typically through an inverse relationship). At the same time, both are important tools for hedging against inflation, so their prices also tend to rise when inflation expectations increase. In addition, global geopolitical risk is another key variable that can affect both prices simultaneously.
Q: How should ordinary investors participate in the gold or crude oil markets?
A: For ordinary investors, directly trading physical commodities or futures involves relatively high barriers. More convenient options include:
- Gold investment: Investors can use gold ETFs (such as GLD and IAU), open a bank gold passbook account, purchase shares of gold mining companies, or invest in related funds.
- Crude oil investment: Investors can invest in ETFs that track oil prices (such as USO and BNO), purchase shares of major oil companies (such as XOM and CVX), or invest in mutual funds focused on the energy sector.
Q: Is the “gold-to-oil ratio” a reliable trading signal?
A: It is a highly valuable “reference indicator”, but it should not be treated as the sole or absolutely reliable trading signal. The gold-to-oil ratio reflects the market’s relative views on risk and growth, and its historical extremes often indicate potential turning points. However, market structures change, and history does not simply repeat itself. The wisest approach is to incorporate gold-to-oil ratio analysis into your overall investment decision-making framework and use it together with other macroeconomic indicators and fundamental analysis.
Conclusion
In summary, “oil rises, gold rises” is a common but not inevitable phenomenon in financial markets. The relationship between gold and crude oil prices is the complex result of multiple forces, including inflation, the US dollar, geopolitics, and market sentiment. Understanding why the two sometimes move together and sometimes diverge depends on identifying the market’s dominant concern at the time: fear of uncontrolled inflation or concern over an economic recession.
For investors seeking to navigate these two important assets, the “gold-to-oil ratio”, in addition to traditional macroeconomic analysis, provides a unique and broad perspective that helps measure risk premiums and the temperature of market sentiment. Before making any related investment decision, be sure to assess all relevant factors comprehensively and make effective use of analytical tools to move steadily through the waves of the global economy.