ETF Return Guide: Avoid Expense Ratio Traps

Updated: 2026/03/31  |  CashbackIsland

fund-etf-return-calculation-guide

Fund ETF Return Rate Calculation Guide: Avoid the Total Expense Ratio Trap and Maximize Your Investment Returns

Why does your fund or ETF appear profitable on paper, yet the actual return you receive often falls short of expectations? Many investors, when conducting fund return rate inquiry, tend to overlook the hidden factor in the details, the impact of the fund total expense ratio. This seemingly small percentage gradually erodes your profits year after year. This article provides a complete ETF return rate calculation guide, teaching you how to accurately evaluate investment performance, uncover the truth about fees, and become a more informed investor. 


Why You Should Learn to Calculate Fund and ETF Return Rates Yourself

In an era of information overload, fund companies and platforms present a wide range of return figures, but learning to calculate them yourself is the first step to gaining control over your investments. This is not only for verifying numbers, but also for developing an independent investment mindset.


Understand True Investment Performance Instead of Paper Gains

Have you ever felt pleased seeing positive returns on your fund statement, only to realize that the growth in value does not quite match your total investment cost? This is the trap of “paper gains”. The returns displayed on platforms may not fully account for all transaction costs, taxes, or losses from currency conversion. Only by calculating it yourself, including all invested capital and final value, can you determine your true investment performance and understand whether you are actually making money or just appearing to.


Identify the Gap Between Marketing Claims and Actual Returns

“Achieved a 20% Return Over the Past Year!” Such promotional slogans are highly eye-catching, but what they do not tell you is whether the return is before or after fees, whether it includes dividends or excludes them, and whether the calculation period has been “polished” By learning how to calculate total return and annualized return, it is like having a mirror that reveals the truth, allowing you to see through flashy marketing claims and understand the most basic and genuine performance of a fund or ETF, thereby making more rational investment decisions.


Core Return Rate Calculation Formulas: Understanding ETF Return Rate Calculation Methods

Calculating return rates is not as complicated as it seems. By mastering the following two core formulas, you can handle most scenarios. Let us start with the most basic total return.


Total Return: The Most Direct Indicator of Profit and Loss

Total return is the most intuitive performance metric, showing how much your investment has grown or declined over the entire holding period. When calculating, remember to include dividends or reinvested capital gains.

  • Formula:  Total return = (ending value – initial principal + total dividends) / initial principal × 100%

Example:
Assume you invest 10,000 at the beginning of the year in an ETF. By year-end, its market value rises to 11,000, and you receive 500 in cash dividends during the period. Your total return is:
(11,000 – 10,000 + 500) / 10,000 × 100% = 15%
This 15% represents your true investment return, which is more accurate than simply looking at the 10% price increase.

總回報率計算公式的示意圖,顯示期初本金加上資本利得與總配息後等於期末總價值。

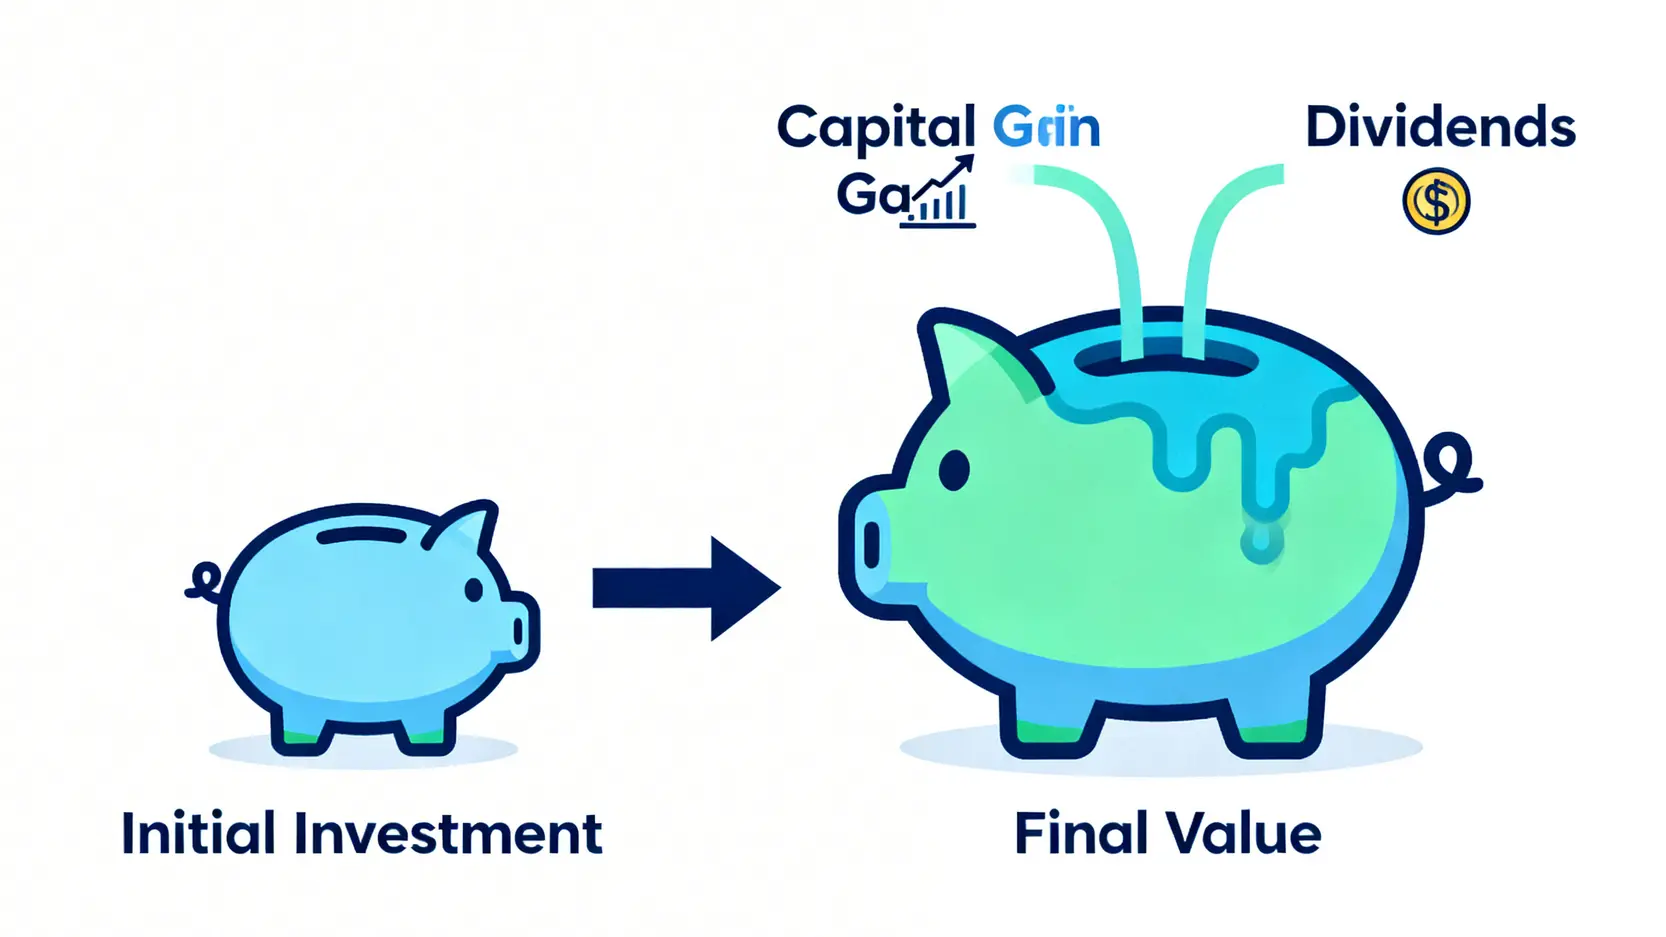
Total Return = Capital Gains (Price Difference) + Dividend Income


Annualized Return: How to Fairly Compare Different Investment Products

If you invest in product A for 3 years and earn 30%, and invest in product B for 5 years and earn 45%, which performs better? This is where annualized return becomes useful. It converts returns over different periods into a comparable annual average.

  • Formula: Annualized return = [(1 + total return)^(1/number of years)] – 1

Example:

Continuing the example, assume product A has a total return of 30% (1.3) over 3 years, and product B has a total return of 45% (1.45) over 5 years.

  • Product A annualized return = [(1.3)^(1/3)] – 1 ≈ 9.14%
  • Product B annualized return = [(1.45)^(1/5)] – 1 ≈ 7.71%

After calculation, although product B has a higher total return, product A actually has better annual growth efficiency. For more details on annualized return calculations and applications, you can refer to this leveraged investment guide: Can You Make Money by Borrowing to Invest? 5 Key Steps and Risk Analysis

Practical Tools Recommendation: Popular Fund Return Rate Inquiry Websites and Calculators

While manual calculation helps you understand the principles, using tools can improve efficiency. The following are some widely recognized resources:

  • Fund company official websites and prospectuses: The most authoritative sources, providing historical performance and fee structures.
  • Broker or bank apps: Most platforms offer basic portfolio return analysis functions.
  • Third-party financial data websites: Morningstar is a globally recognized fund rating and data provider, offering detailed fund information, including historical returns, risk ratings, and expense ratio analysis, making it an essential tool for professional investors.


Further Reading (Highly Recommended)

Gold Investment Beginner Guide: Analysis of 5 Major Channels, Advantages, and Risks

Fund Trading Process Guide: From Subscription to Redemption, Master 5 Key Steps (With Fee Overview)


The Devil Is in the Details: How the Total Expense Ratio Erodes Your Returns

After learning how to calculate returns, the next step is controlling costs. The total expense ratio (TER), also known as the “internal expense ratio”, is a key factor affecting long-term returns, yet often overlooked by beginners.


What Is the Total Expense Ratio (TER)? What Hidden Costs Does It Include?

TER refers to the percentage of a fund’s total assets used annually to cover operational and management expenses. This cost is directly deducted from the fund’s net asset value, and investors do not receive a bill, making it easy to overlook. It mainly includes:

  • Management fee: Paid to the fund management team for research and portfolio management, and usually the largest component.
  • Custodian fee: Paid to financial institutions responsible for safeguarding the fund’s assets.
  • Administrative fee: Covers accounting, legal, registration, transfer agent, and other operational expenses.
  • Other costs: Such as audit fees, legal fees, and index licensing fees.

It is important to note that TER does not include transaction fees, subscription fees, redemption fees, or switching fees. These are “additional costs” that investors must pay separately.


Case Study: How TER Gradually Impacts Returns Over 10 Years

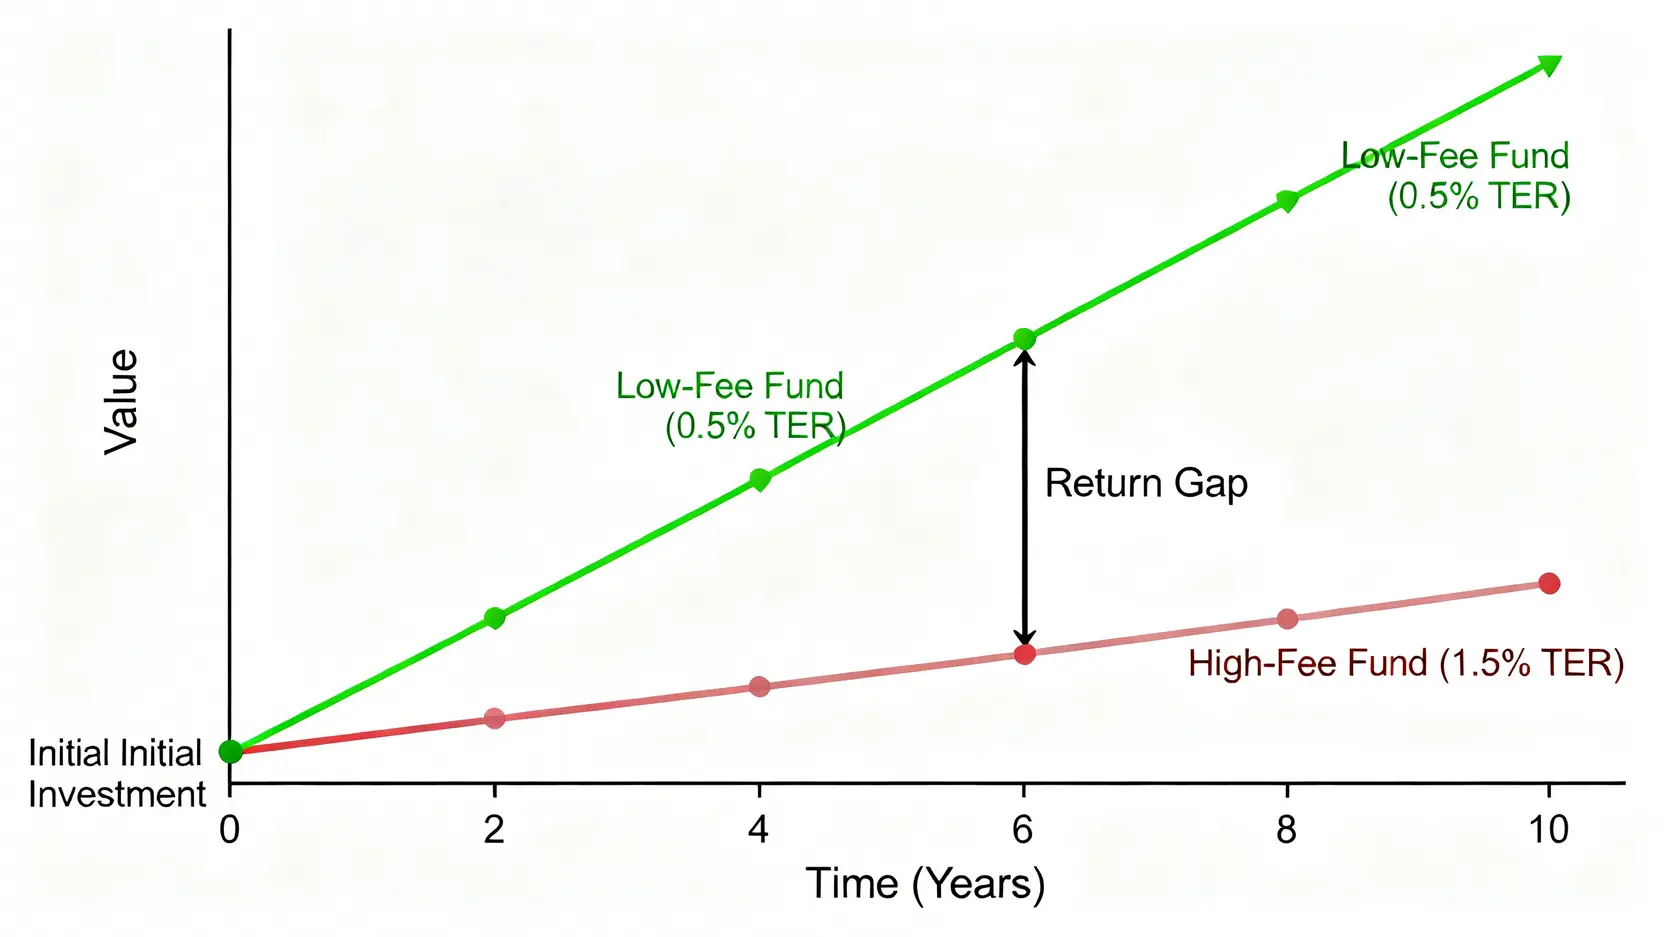
Although fees may seem insignificant, under the effect of “compounding”, the long-term difference can be substantial. Consider a simple example:

Assume both Fund A and Fund B have an annual return of 8% (before fees). Fund A has a TER of 0.5%, while Fund B has a TER of 1.5%. If an investor invests 1,000,000 and holds for 10 years, what will be the outcome?

Item Fund A (Low Cost) Fund B (High Cost)

Difference

Annualized Total Return 8% 8%
Total Expense Ratio (TER) 0.5% 1.5%
Investor’s Net Annualized Return 7.5% 6.5%
Final Value After 10 Years Approximately 2,061,032 yuan

Approximately 1,877,137 yuan

183,895 yuan

A mere 1% difference in fees can result in a profit gap of over 180,000 after 10 years. If the time horizon extends to 20 or 30 years, this gap will grow exponentially. This is precisely why investment masters like Warren Buffett place such strong emphasis on low-cost investing.

一張折線圖比較低費用基金與高費用基金在十年後的投資回報差距,顯示高費用顯著侵蝕了長期利潤。

A 1% fee difference can create a massive profit gap under long-term compounding.


How to Check the Total Expense Ratio of Any Fund or ETF

Checking the TER is a necessary step before investing. You can find this information through the following channels:

  1. Fund prospectus or Key Investor Information Document (KIID): These are the most official and detailed documents, clearly outlining the fee structure.
  2. Fund monthly reports: These usually disclose recent expense ratio data.
  3. Financial information websites: As mentioned earlier, platforms like Morningstar or research reports from major brokers allow you to quickly find a fund’s TER.

Build the habit of spending one minute checking the TER before subscribing to any fund or ETF. This small action can make a significant difference to your long-term returns.


Frequently Asked Questions (FAQ)

Q: Is a fund’s dividend yield the same as its return?

A: Not at all. Dividend yield only represents the portion of returns distributed to investors in cash. It is just one part of the “total return”. Total return must also include capital appreciation (or depreciation) of the fund’s NAV. A fund with a high dividend yield may still have a declining NAV, resulting in a negative total return. Therefore, always focus on “total return” rather than just dividend yield when evaluating performance.

Q: How should returns be calculated for dollar-cost averaging investments?

A: For periodic investments with irregular cash flows, traditional total return or annualized return formulas may be inaccurate. The most precise method is to use the “Internal Rate of Return” (IRR), or the “XIRR” function in Excel or Google Sheets. This method accounts for the timing and amount of each investment, producing a more accurate annualized return.

Q: What additional costs affect returns when investing in overseas ETFs?

A: Besides TER, several additional costs should be considered:

  • Dividend withholding tax: Many countries impose withholding tax on dividends paid to non-residents. For example, US-listed ETFs are typically subject to a 30% withholding tax on dividends.
  • Currency exchange costs: Banks or brokers charge spreads when converting currencies.
  • Overseas brokerage fees: Trading through international brokers or cross-border transactions incurs additional fees.

These factors all impact your final net profit and should be included in your decision-making process.


Conclusion

To become a smarter investor, you must learn both how to calculate fund returns and how to evaluate costs. Ignore misleading marketing figures, calculate your real returns, and incorporate the impact of the Total Expense Ratio into your decision-making process. Starting today, use the correct formulas and tools to reassess your investment portfolio and ensure every dollar you invest is working at its maximum potential. Take action now to check the TER of your funds and remove obstacles to your wealth growth!

If you liked this article, please share it!

Related Articles

  • Volatility Surface Guide: Skew Trading Strategies
    Practical Applications of Volatility Surfaces: From Options Modeling to Advanced Skew Trading Strategies In options markets, implied volatility is never a flat line. Instead, it forms complex "smile" or "skew" surfaces. For advanced traders, mastering the practical applications of volatility surfaces is equivalent to possessing a lens that reveals market...
    2026 年 6 月 3 日
  • Foreign Capital Flow Model: Track Institutional Money
    Building a Foreign Capital Flow Copy Trading Model: A Stock Market Indicator for Accurately Tracking Institutional Positioning In Asia-Pacific stock markets, foreign capital inflows and outflows often determine the direction of the index. However, simply looking at daily net buy and sell data is no longer enough. Only by building...
    2026 年 6 月 3 日
  • Options Buying Strategies for Extreme Market Risks
    Options Buyer Strategies During Extreme Market Conditions: Black Swan Hedging and Cross-Market Arbitrage During Volatility Surges The most terrifying aspect of financial markets is not a gradual decline, but overnight flash crashes and cross-market capital withdrawals accompanied by volatility surges. In the highly unpredictable global macroeconomic environment of 2026, geopolitical...
    2026 年 6 月 3 日
返回顶部