What are Candlesticks? The Universal Language for Instantly Understanding Market Sentiment
Candlesticks, also known as “K-lines” or “candle charts,” are a technical analysis tool originating from the 18th-century Japanese rice market. They have endured to become the standard language in global financial markets—be it stocks, forex, futures, or cryptocurrencies—because they visually represent the “battle between bulls and bears” within a specific timeframe in an extremely intuitive way.
Instead of thinking of them as complex data, imagine each candlestick as a snapshot of a tug-of-war match. Each candle clearly records four key prices:
Open: The price at the start of the match
High: The highest point reached by the bulls (buyers)
Low: The lowest point the bears (sellers) could push the price down to
Close: The final price when the match ended
The figure formed by these four prices is like an “X-ray” of market sentiment, allowing us to see the underlying strength of bulls and bears at a glance. Simply put:
Bullish Candle (usually green or white in the West): Represents the close price being higher than the open price. The buyers are in control, and market sentiment is optimistic. The longer the body, the stronger the buying momentum.
Bearish Candle (usually red or black in the West): Represents the close price being lower than the open price. The sellers are dominant, and market sentiment is pessimistic. The longer the body, the heavier the selling pressure.
How to Read a Candlestick Chart? The Four Core Secrets of a Single Candle
To master candlesticks, you must first learn to interpret the information revealed by a single candle. Every part of it—the body, the shadow (wick), and its color—sends you a different signal.
The Body: The Main Battlefield for Bulls and Bears
The body is the area between the open and close prices and is the core of the entire candlestick. It directly reflects the main outcome of the period’s battle.
Long Body: Whether bullish or bearish, a long body signifies that one side has achieved a decisive victory, and the trend momentum is very strong.
Short Body: This indicates that the bulls and bears are evenly matched, and the market is in a state of hesitation or consolidation. The existing trend may be weakening.
Upper Shadow (Wick): The Limit of the Advance and Selling Pressure
The upper shadow is the thin line between the high price and the top of the body. It represents a price advance during the period that was ultimately pushed back down by sellers.
Long Upper Shadow: This implies significant selling pressure from above. Even if it’s a bullish candle, be cautious as the upward momentum may be hindered.
Short or No Upper Shadow: This indicates that the upward move was smooth with little to no resistance.
Lower Shadow (Wick): The Support Baseline and Buying Interest
The lower shadow is the thin line between the low price and the bottom of the body. It shows that the price once fell but was met with strong support from buyers who pushed the price back up.
Long Lower Shadow: This represents strong underlying support. Even if it’s a bearish candle, it suggests that the downward momentum may be nearing exhaustion.
Short or No Lower Shadow: This indicates a decline with no resistance, where sellers are in complete control.
Basic Candlestick Patterns: Practical Interpretation from Single Candles to Combinations
A single candlestick is like a letter of the alphabet. When multiple candlesticks combine, they form words and sentences that convey richer market meanings. Below are some of the most common and valuable candlestick patterns used in real-world trading.
Powerful Reversal Signals: Warning Lights for Market Turns
The appearance of these patterns often indicates that the current trend is about to end and a new one may be starting. They are like traffic lights, signaling that it’s time to prepare for a turn.
Pattern Name
Market Implication
Trading Strategy
Hammer / Hanging Man
Both look identical (small body, long lower shadow), but their location is key. A Hammer appears at the end of a downtrend and is a strong bottoming signal. A Hanging Man appears at the top of an uptrend and is a topping warning.
Consider a long position on a Hammer; consider reducing positions or going short on a Hanging Man.
Inverted Hammer / Shooting Star
Both have a small body and a long upper shadow. An Inverted Hammer appears in a downtrend and is a potential bottom signal. A Shooting Star appears in an uptrend and is a strong top signal, implying a failed rally.
The sell signal from a Shooting Star is generally more reliable than the buy signal from an Inverted Hammer.
Doji
The open and close prices are nearly identical, representing an absolute balance between bulls and bears. It’s often a sign of market indecision and a potential trend reversal. Variations include Long-Legged Doji, Gravestone Doji, and Dragonfly Doji.
A standalone Doji is not very significant; it must be interpreted with surrounding candles and its position in the trend. It’s an important observation signal, not a direct trading signal.
💡 Recommended Article
Candlesticks are a core tool in technical analysis. Want to build a more complete analytical system? Recommended reading:
Classic Combination Patterns: The Market’s Amplified Scenarios
When two or three candlesticks combine, they tell a more complete and reliable story. These are the patterns most traders rely on for their judgments.
Pattern Name
Market Implication
Trading Strategy
Bullish Engulfing
In a downtrend, a large bullish candle’s body completely engulfs the previous bearish candle’s body. It symbolizes a sudden burst of buying power, wiping out the sellers’ ground. It is a strong bullish reversal signal.
A highly reliable signal. Consider entering a long position after the next candle confirms the upward move.
Bearish Engulfing
In an uptrend, a large bearish candle’s body completely engulfs the previous bullish candle’s body. It represents a powerful reversal by sellers and is a strong bearish reversal signal.
A reliable top signal. Consider closing long positions or initiating a short position here.
Morning Star
A three-candle pattern: a long bearish candle, followed by a Doji or small-bodied candle, and then a long bullish candle. It appears at the end of a downtrend, symbolizing night passing and dawn arriving. A classic bottom reversal pattern.
After confirmation (the third bullish candle’s body closes above the midpoint of the first bearish candle’s body), it is a reliable buying opportunity.
Evening Star
A three-candle pattern: a long bullish candle, followed by a Doji or small-bodied candle, and then a long bearish candle. It appears at the top of an uptrend, like the sun setting and night falling. A classic top reversal pattern.
After confirmation, it is a strong signal to sell or go short.
How to Integrate Candlestick Analysis into Your Trading Strategy?
Learning to identify candlestick patterns is just the first step. True experts know how to combine it with other analytical tools to form a complete trading system. Trading based solely on candlestick patterns is extremely risky. A smarter approach is to:
1. Combine with Trendlines and Support/Resistance Levels
The power of a candlestick pattern is amplified at key levels. For example, in a clear uptrend, when the price pulls back to a trendline and a perfect “Hammer” pattern appears, the reliability of this buy signal is far greater than a signal appearing in a sideways market.
2. Use in Conjunction with Trading Volume
Volume is a crucial indicator of market participation and can validate the authenticity of a candlestick pattern. If a reversal signal (like an engulfing pattern) is accompanied by a significant increase in volume, it suggests the transfer of power between bulls and bears is genuine, greatly increasing the probability of a trend reversal. Conversely, without volume confirmation, it could be a “false move” that requires caution.
3. Look for Confirmation Across Different Timeframes
If you primarily trade on the daily chart, then the weekly and monthly charts are your “weather forecast.” When a buy signal appears on the daily chart, if the weekly chart is also in an uptrend or showing a support signal, this is known as “timeframe confluence,” which significantly increases the trade’s probability of success.
💡 Recommended Article
Combining other indicators will give you a more three-dimensional view of the market. Recommended reading:
Common Pitfalls and Key Considerations in Candlestick Analysis
Candlestick analysis is a blend of art and science, not a crystal ball that’s always right. In practical application, you must be aware of the following common pitfalls to avoid unnecessary losses.
Don’t rely on a single signal: Any candlestick pattern needs a subsequent candle for “confirmation.” For example, after seeing a Hammer, it’s best to wait for the next candle to close above the Hammer’s high before entering a trade.
Accept the reality of probability: No single pattern is 100% accurate. It provides a high-probability opportunity, but you must set a stop-loss for when it inevitably fails.
Context is everything: The same candlestick pattern can have completely different meanings in a bull market versus a bear market. Interpreting a pattern in isolation from the broader market environment is a classic rookie mistake.
Beware of liquidity traps: In markets or time periods with low trading volume, candlestick charts can easily show “glitches” or false signals, reducing their reliability.
Conclusion
Mastering candlestick charting is like learning to listen to the market’s heartbeat. It transforms cold price data into a vivid story filled with the emotional struggle between bulls and bears. From understanding the structure of a single candle, to identifying key reversal and continuation patterns, and finally integrating them into a complete trading strategy, this is a path that requires continuous learning and practice.
Remember, candlesticks provide a high-probability “reference” for decision-making, not an absolute “answer.” Only by combining candlestick analysis with disciplined money management and risk control can you navigate the ever-changing financial markets steadily and successfully.
Frequently Asked Questions (FAQ)
❓Do candlestick colors differ between countries/regions?
Yes, and this is very important. In Chinese-speaking regions like mainland China, it is customary to use “red” for up (bullish) and “green” for down (bearish). However, in Western countries like Europe and America, the opposite is common: “green” or “white” for up, and “red” or “black” for down. When using different trading platforms, always confirm their color settings first.
❓What does a Doji mean? Is it a buy signal?
A Doji itself represents “indecision” or “balance of power” between bulls and bears. It is a neutral signal, not a direct buy or sell signal. Its core meaning is to act as a “warning”—the current trend may be pausing or reversing. Whether it constitutes a trading opportunity depends entirely on where it appears and the candles that surround it. For example, a Doji appearing after a long downtrend may signal a potential bottom; if it appears after a sharp rally, it could be a warning of a top.
❓Is candlestick analysis applicable to all financial instruments?
Yes, the application of candlestick analysis is very broad. Whether it’s stocks, forex, gold, crude oil, or Bitcoin, as long as an asset’s price is determined by buyers and sellers in the market, the struggle between bulls and bears will leave its trace on the chart. Therefore, the logic and pattern interpretation of candlestick analysis are applicable to almost all financial markets with good liquidity.
❓How long does it take to get proficient at candlestick analysis?
“Learning” to identify basic patterns might only take a few days, but achieving “mastery” and being able to apply them flexibly in real trading requires long-term practice, review, and reflection. It is recommended that beginners start by identifying major patterns on the daily chart and use demo trading to test their judgments. There are no shortcuts; continuous chart-watching and practice are the only ways to turn knowledge into profitability.
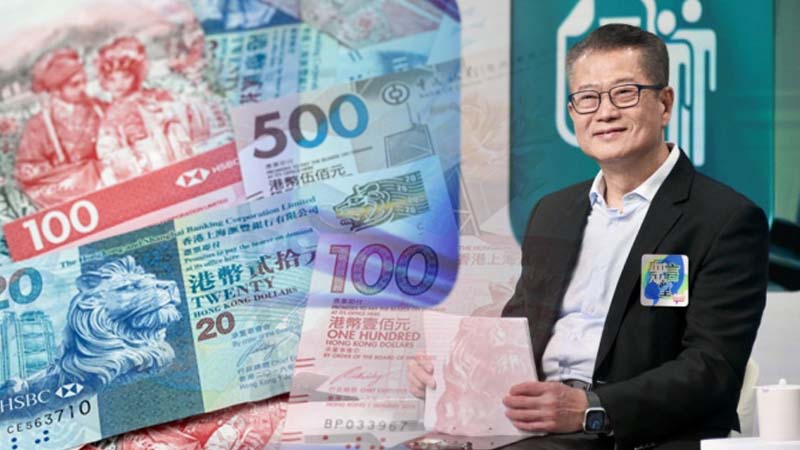
As the announcement of the 2025 Budget on February 26, 2025, approaches, Hong Kong society is closely watching how the government will balance the need for relief measures with structural reforms amidst the pressure of its HK$680 billion fiscal reserves. Financial Secretary Paul Chan Mo-po's recent emphasis on "precision in...
The Hong Kong Securities and Futures Commission (SFC) officially granted operating licenses to two cryptocurrency trading platforms—PantherTrade and YAX—on January 27, 2025, further promoting the compliant development of Hong Kong's crypto market. Since launching its licensing program in mid-2024, the SFC has issued licenses to seven Virtual Asset Trading Platforms...
As the U.S. Consumer Price Index (CPI) for January exceeded expectations, market forecasts for the Federal Reserve's future monetary policy shifted, causing the U.S. Dollar Index to rise rapidly and leading to a pullback in gold prices. However, despite this pressure, the gold market still shows potential for growth, primarily...